The May 31st 2002 Severe Weather / Tornado
Outbreak
Severe weather developed during the afternoon on the 31st as a cold front moved across the area. A broken line of thunderstorms moved southeast central New York during the early afternoon producing spotty, light straight-line wind damage. A second round of thunderstorms developed behind the first line later in the afternoon and produced 4 confirmed tornadoes: F1s near Owego and Lordsville, and F0s near Deposit and Cooperstown. This study will review 1) the large-scale pattern associated with this event, 2) forecast and observed soundings associated with the event, and 3) some radar imagery associated with the event.
- Large
Scale Pattern
The first figure in this case study is a surface plot taken over the northeast U.S. at 17z on 5/31/02.
Surface plot at 5/31 17z.
The surface cold front at 17z was still located west of Buffalo, with dew points through-out western and central New York and Pennsylvania still in the 60s. A southwest flow was indicated through-out the area, with no obvious pre-frontal troughs indicated.
The upper-level pattern associated with the severe weather outbreak of May 31st, 2002 was classic for the northeast U.S. in that it was characterized by northwest flow. The figure below shows the 250 mb heights and wind speed forecast by the 12z 5/31 run of the Eta model verifying at 18z on 5/31.
6 hour Eta forecast
250 mb heights and wind speed verifying at 5/31 18 UTC.
Note the west-northwest flow from the Great Lakes southeast across western New York. New York was located in the exit region of a jet streak located over the northern Plains and northwest Great Lakes. The next figure shows a 6-hour Eta forecast of 250 mb wind speed and divergence verifying at 5/31 18z.
6-hour Eta forecast 250 mb wind speed, ageostrophic wind and divergence verifying at 5/31 18z.
A thermally indirect circulation was forecast to develop in the exit region of the jet, with rising motion on the left (cold) side and sinking motion on the right (warm) side. Western New York and northern Pennsylvania were in the quadrant where rising motion was favored. The following figure is a schematic illustrating the conceptual model associated with an indirect circulation associated with the exit region of a jet streak.
divergence convergence
![]()

N S
![]()
Schematic of a thermally indirect circulation in the exit region of an upper level jet streak.
The lower part of the circulation associated with the jet exit region can be inferred by looking at the following figure, which shows forecasts of 850 mb ageostrophic wind, 250 mb wind speed and 850 mb divergence.
6-hour Eta forecast 850 mb ageostrophic wind, 850 mb divergence and 250 mb wind speed verifying 5/31 18z.
Note the enhanced, ageostrophic southerly flow over Pennsylvania and eastern New York. 850 mb divergence was forecast to develop on the leading edge of this ageostrophic low-level jet across upstate New York during the afternoon of the 31st.
The following figure shows a 6-hour Eta forecast of 900 mb wind and CAPE verifying at 5/31 18z.
6-hour Eta forecast 900 mb wind and CAPE verifying 5/31 18z.
Note the strong southwest low-level flow transporting high values of CAPE northeast toward New York. The southwest low-level flow was likely enhanced as part of the indirect circulation associated with the upper-level jet.
It has been hypothesized that one reason why northwest flow aloft is so favorable for severe weather over the northeast United States is that a veering wind profile with northwest flow aloft is favorable for differential theta-e advection, with warming and moistening in the low-levels and cooling and drying aloft leading to destabilization of the atmosphere. The following figure shows a forecast cross section of theta-e advection verifying at 5/31 18z over the area where the thunderstorms developed.
6-hour Eta forecast cross section of theta-e advection and wind from Philadelphia to Buffalo verifying at 5/31 18z.
Note the pronounced area of cold/dry advection aloft above and southeast of Buffalo, overlying an area of warm/moist advection at low-levels. This would have acted to strongly destabilize the area.
The following figure shows a 6-hour Eta forecast of 700 mb vertical motion, verifying at 18z on 5/31.
6-hour Eta forecast 700 mb vertical motion verifying 5/31 18z.
Note the large area of upward vertical motion forecast over central New York and northeast Pennsylvania during the afternoon on the 31st. This large-scale vertical motion would have also acted to destabilize the area that was already destabilizing due to the effects of the differential theta-e advection shown in the previous figures. Clearly, the stage was set for convection to develop during the afternoon of the 31st. The next section will try to describe the factors that led to the particular type of convective organization (tornadic supercells) that occurred on that day.
- Soundings
The first figure in this section shows the observed Buffalo sounding from 5/31 12z. Strong speed and directional shear is indicated from the surface through 700 mb, indicating the potential for thunderstorms rotation.
Observed Buffalo sounding taken at 12z on 5/31.
The observed CAPE at Buffalo at 12z was 797 J/kg; pretty impressive for early in the day. In addition, the pressure of the lifting condensation level was rather low; 922 mb. Observational studies indicate that low lifting condensation levels are favorable for tornado development. The threshold for LCL heights often cited in recent studies is 3 km; however these studies relatively dry include high-plains environments. A better threshold for eastern U.S. environments may be 1 km.
The following figure is an Eta forecast BUFKIT sounding verifying at 19z on the 31st at BGM.

Eta BUFKIT sounding at BGM verifying at 5/31 19z. Hodograph is from 0
to 2 km.
The key parameters to observe from this sounding are 1) a lifting condensation level below 1 km. 2) Strong low-level shear, with a 0-2 km shear value of 17 m/s (around 35 kts), and a 0-2 km storm relative helicity of 186 m/s2. The 0-1 km shear and storm relative helicity (not shown) were forecast to be 11 m/s and 125 m/s2. The forecast CAPE of 1104 J/kg, while fairly impressive, may have been a little underdone, as the model was producing convective precipitation at the time of the sounding, so that the forecast sounding was stabilizing as it trended toward the Eta’s reference profile for convection. The forecast Energy Helicity Index (EHI) was 1.58. Values of greater than 1.00 have been found to be favorable for tornadoes in the eastern United States.
The next figure shows and Eta forecast BUFKIT sounding verifying again at 5/31 19z. This time, the hodograph shown is from 0 to 6 km.
Eta forecast BUFKIT sounding verifying at 19z 5/31. Hodograph is from 0 to 6 km.
Key parameters from this figure are the storm relative helicity of 209 m/s2 and the 6 km storm relative flow of 13 m/s from 234 degrees. This represents a significant rear-to-front storm mid-level storm relative flow for any storms moving at the forecast speed and direction of 285 degrees and 20 m/s. Recent research indicates that strong rear-to-front mid-level storm relative flow (associated with deep shear) can be an important ingredient for tornadogenesis. The reason that rear-to-front storm relative flow is favorable for tornadogenesis is that rear-to-front storm relative flow pushes the storm’s precipitation core downstream of the storm’s downdraft. The result is less evaporational cooling within the downdraft, which leads to a weaker cold pool. Weak (warm) cold pools have been shown to be favorable for tornadogenesis.
The next two figures show Eta BUFKIT soundings verifying at 21z on 5/31 at BGM.
The hodograph on the first figure is from 0-2 km and the hodograph on the second figure is from 0-6 km.

Eta forecast BUFKIT sounding verifying at 21z 5/31/02. Hodograph is
from 0 to 2 km.
Key parameters in this figure are once again the low lifted condensation level (below 1 km) and the large lower-tropospheric shear and storm relative helicity values (0-2 km shear of 20 m/s and 0-2 km storm relative helicity of 187 m/s2. The 0-1 km shear and helicity values (not shown) were 10 m/s and 128 m/s. The model is forecasting some drying aloft, and forecast CAPE values remain moderately high (1003 J/kg). The forecast EHI at this time was 1.27.
Eta forecast BUFKIT sounding verifying at 21 5/31/02. Hodograph is from 0 to 6 km.
The key parameters on this figure are the very strong 0-6 km shear (41 m/s) and the storm relative flow at 6 km of 16 m/s from 229 degrees.
In summary, the observed and forecast soundings were very favorable for tornadogenesis in this case. Specifically, the data all indicated the following factors that would be favorable for tornadogenesis 1) strong low-level shear and storm-relative helicity, 2) moderately strong instability and 3) low LCL heights. These parameters were all favorable by early afternoon on the 31st, and remained favorable through late afternoon.
- Radar
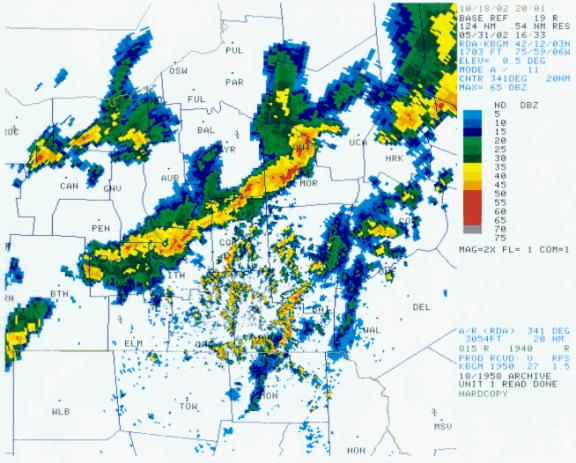
The following figures show a sequence of 0.5 degree reflectivity images from the WSR-88D at BGM, from 1800 UTC through 2100 UTC on 5/31/02. A broken line of showers and thunderstorms moved southeast across the area between 15:00 UTC and 19:00 UTC. Damage with this line was light and spotty. No tornadoes were reported. The first tornadic supercell developed northwest of Owego around 18:30 UTC. That storm moved southeast, producing a tornado just to the north of Owego around 19:45 UTC. The storm continued to the southeast, producing another tornado near Lordsville shortly after 21:00 UTC.
Two lines of weak to moderately strong thunderstorms
develop and move southeast.

Base reflectivity at 15:48 UTC 5/31/02.
Base reflectivity at 16:33 UTC 5/31/02.
Base reflectivity at 17:14 UTC 5/31/02.
The primary line of thunderstorms moves southeast of
Binghamton.![]()
![]()
Base reflectivity at
18:00 UTC 5/31/02
New supercell develops here, behind the primary line of
thunderstorms.
![]()
Base reflectivity at 18:45 UTC 5/31/02.
Tornado developed just after this time, north of Owego.![]()
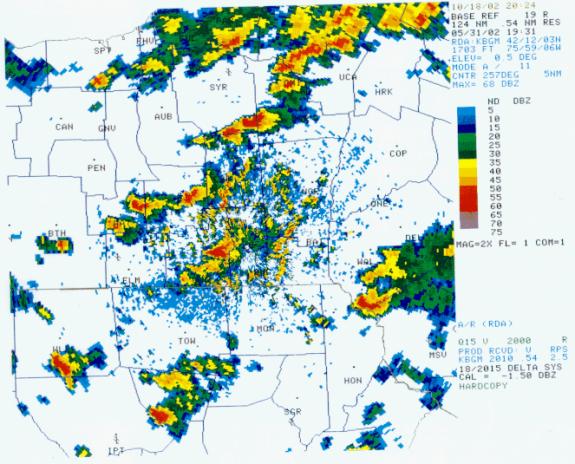
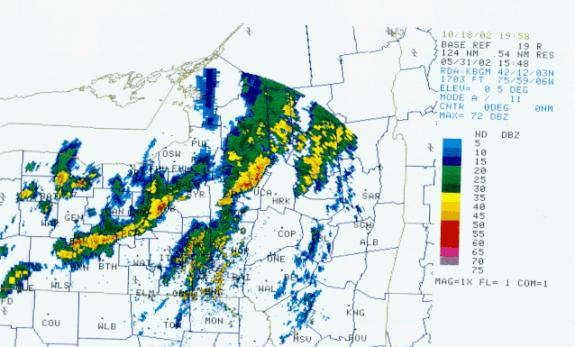
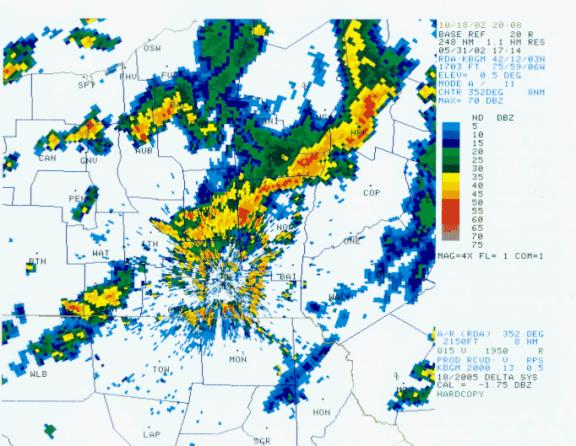
Base reflectivity 19:31 UTC 5/31/02
Rotational couplet north of Owego at 19:31 UTC.
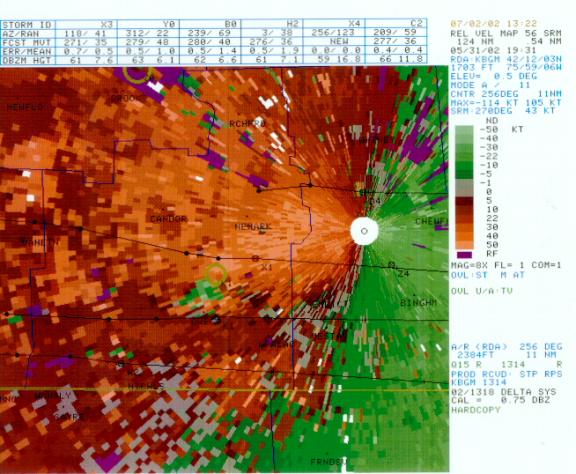
Storm relative velocity at 19:31 UTC 5/31/02.
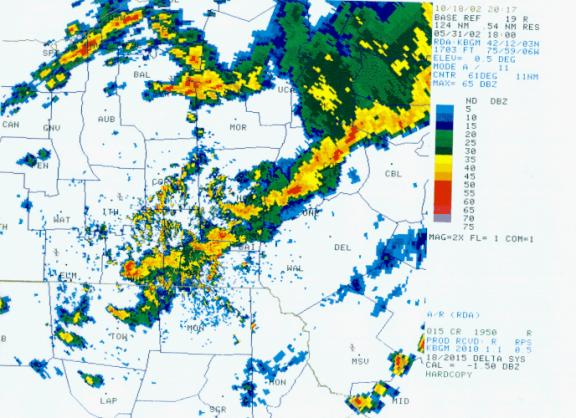
The supercell moves southeast of Binghamton. No tornadoes are reported at this time.![]()
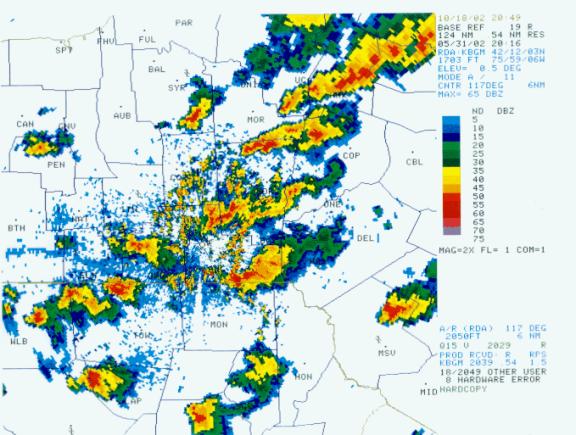
Base reflectivity at 20:16 UTC 5/31/02.
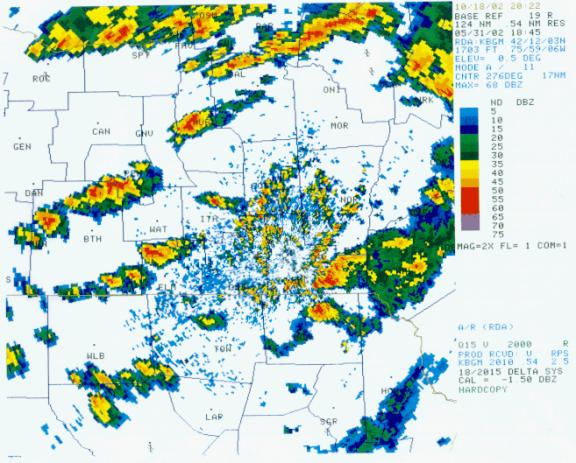
Tornadic storm near Lordsville![]()
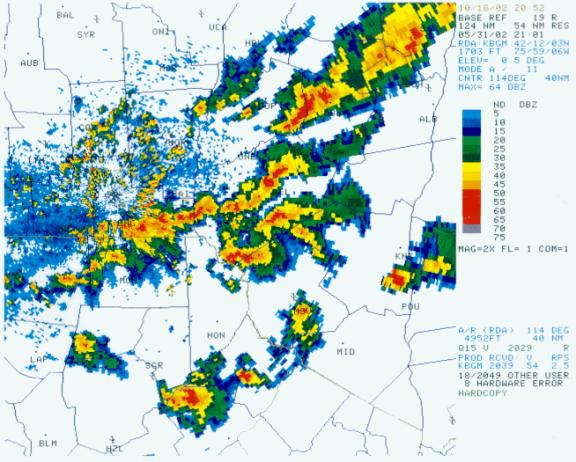
Base reflectivity at 21:01 UTC 5/31/02.
Rotational couplet near Lordsville


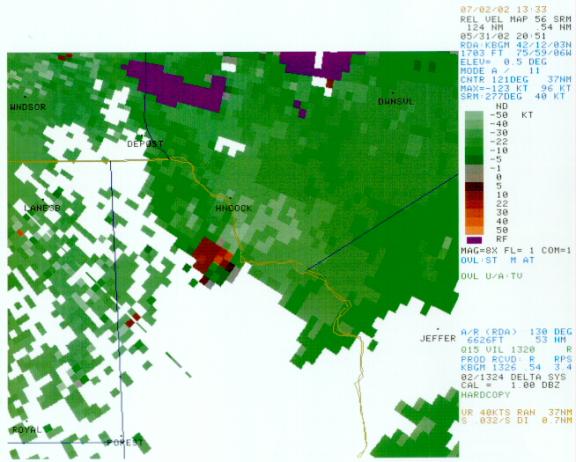
Storm relative velocity at 20:51 UTC 5/31/02.
In summary, a line of showers and thunderstorms moved southeast across the area during the early afternoon. Despite favorable large-scale conditions, none of these storms developed significant rotation, and no tornadoes were reported. The fact that significant rotation developed with storms that followed behind this line suggests that low-level boundaries produced by the line may have acted to enhance the low-level convergence associated with subsequent storms. No strong evidence was found for that hypothesis in the WSR-88D BGM velocity or storm relative velocity data. Another possible explanation for the tornadogenesis associated with the second wave of storms may be that the rain from the first line of storms resulted in an environment characterized by increased low-level moisture, and lower LCL heights. Low-level moisture pooling near an approaching cold front may have also been a factor that locally increased low-level moisture. The result of this increase in low-level moisture was an environment that was more favorable for tornado formation. The final figure shows a surface plot at 19z on the 5/31. Note that the highest dew points on the map are indicated at BGM and SYR, just ahead of the cold front in an environment where storms are either occurring or are very nearby.
Surface plot at 19z 5/31/02.