January 6th, 2002
OBSERVATIONS AND LARGE SCALE
FORCING
The event began as snow spread north across northeastern Pennsylvania late in the afternoon on January 6th while low pressure moved northeast off of the mid-Atlantic coast. At upper levels, there appeared to be a “coupled jet” pattern, with northern Pennsylvania being in the right entrance region of an upper jet located over New England, and the left exit region of an upper level jet over the mid-Atlantic region.
A 12 hour eta forecast of surface pressure and 850 mb temperature verifying at 1/7 00z.
A 12 hour eta forecast of 300 mb heights and wind speed, verifying at 1/7 00z.
The following figure shows a map of potential vorticity in the layer between 500 and 300 mb. A strong maximum of PV is indicated over the mid-Atlantic region, moving northeast. A second lobe of high PV is located back over the lower Mississippi Valley.
12 hr eta forecast PV in the layer from 500 to 300 mb verifying 1/7 00z.
The large-scale geostrophic forcing for upward motion in this case can by implied from the following figure. Divergence of Q vectors is shown in the layer from 500 to 400 mb. Recall that upward motion is favored in areas where the divergence is negative. Recall also that the vertical motion implied by the divergence of Q does not include the effects of stability on the vertical motion. In addition, the divergence of Q will not do a good job capturing the details of the vertical motion field in locations where there are strong ageostrophic winds, ie near fronts and jet streaks. In a case like this, where fronts and jet streaks are important, the divergence of Q cannot accurately predict the total vertical motion field; instead it should be thought of as depicting the “large-scale” forcing for vertical motion. In this case, note the strong forcing for upward motion extending northeast from the mid-Atlantic coast toward southern Pennsylvania.
12 hr eta forecast 500-400 mb divergence of Q verifying 1/7 00z.
The result of this pattern was widespread forcing for upward vertical motion across the northern mid-Atlantic region, along with a large area of near saturation. The figure below shows a plan view of eta forecast 600-500 mb layer average vertical motion and relative humidity, verifying at 00z on the 7th. Note that the vertical motion shown in the figure below is the total model forecast of vertical motion, and includes the effects of stability and ageostrophic flow. Including those effects appears to shift the maximum of upward motion northwestward toward central Pennsylvania.
12 hr eta forecast 600-500 mb layer average rh and omega, verifying at 1/7 00z.
The following figures show composite radar images as the snow shield advanced northeast across Pennsylvania. Note the narrow, intense bands of snow that develop across central and northeast Pennsylvania as the snow advances toward the northeast.
The following figure shows the observed precipitation (in mm) that occurred with this event through 1/7 00z.
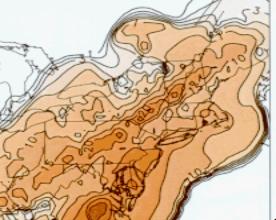
Observed precipitation (mm) from 00z 1/6 through 00z 1/7.
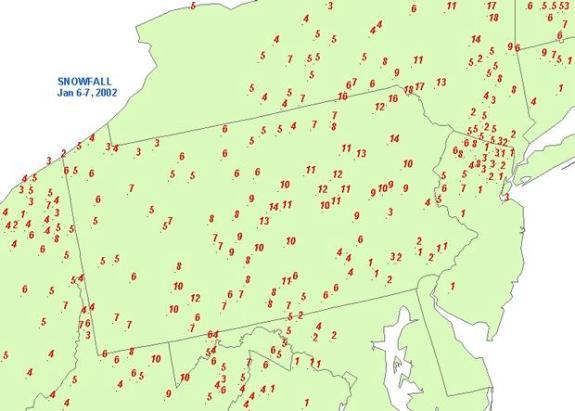
Observed snowfall amounts on January 6th and 7th, 2002.
The following figures show the 3 hour qpf forecasts from the 12z 1/06 run of the Eta model verifying at 21z 1/6, 00z 1/7 and 03z 1/7. Note that the 12z run of the Eta forecast the development of a band of heavy snow quite accurately, placing the band across central and northeast Pennsylvania through 03z on the 7th.
3 hr forecast qpf from the 1/6 12z run of the Eta model verifying at 1/6 21z.
3 hr forecast qpf from the 12z 1/6 run of the Eta model verifying 1/7 00z.
3 hr forecast qpf from the 1/6 12z run of the Eta model verifying 1/7 03z.
The following figure is the Eta total precipitation forecast through 1/7 03z. Note again the accurate placement of the heavy snow band.
12 hr qpf forecast from the 1/6 12z run of the Eta verifying 1/7 06z.
One of the large difficulties with this event was the fact that previous runs of the Eta (and other models) were much farther southeast with the heavy qpf. The following figure shows the forecast 12 hr qpf from the 00z 1/6 run of the Eta, verifying 1/7 06z.
QPFs from the short range ensemble forecasts (SREFs) run at 09z on the 6th indicated a fairly large spread of possible outcomes. Specifically, 2 runs of the 48 km Eta model forecast only 0.20 to 0.40 inches of precipitation across central and northeast Pennsylvania, while another 48 km Eta run forecast as much as 0.80 inches. Large spread was also seen in the RSM runs, with one forecast indicating less than 0.20 inches across northeast Pennsylvania, while two runs indicated a band of greater than 0.60 inches.
18 hr qpf’s from the 48 km non-control runs of the eta model from the short range ensemble forecast package run at 09z on the 6th.
18 hr qpf’s from the non-control runs of the RSM model from the short range ensemble forecast package run at 09z on the 6th.
In contrast to the case on 1/19 2002, the rain to snow ratios with this event were fairly typically for an eastern United States snowstorm; approximately 15 to 1. The following figure shows a BUFKIT forecast sounding at AVP from the Eta model run at 12z on the 6th and verifying at 00z on the 7th. Temperatures are below freezing through the entire depth of the forecast sounding. A warm layer is evident around 800 mb, however temperatures within the warm layer do not exceed 0 degrees C. As was the case on 1/19, temperatures near the surface are just below 0 degrees, however unlike on 1/19, the –15 degree isotherm is elevated well above the 10,000 foot level.
BUFKIT forecast sounding at AVP from the 12z 1/6 Eta verifying at 00z 1/7.
MODEL DIAGNOSTICS
The following figure shows 12-hour eta forecast of 850 mb moisture convergence and wind speed verifying at 1/7 00z. Note that the strongest moisture convergence was located over southern Pennsylvania southward across the Delmarva peninsula. This corresponded well with the area of most widespread heavy precipitation, but was well to the south of the heavy snow area.
12 hour eta forecast of 850 mb moisture convergence and wind speed verifying at 1/7 00z.
To get a good view of the forcing for upward vertical motion in this case, consider the south-north cross section of wind speed and divergence shown below. The figure below shows a sloping area of low-level convergence, associated with a low-level frontal boundary, sloping upward from Delaware toward central New York. This convergence is overlaid by a large, deep area of divergence extending up through 300 mb. The divergence is maximized at two locations: 1) at jet stream level around 200-300 mb, and 2) just above the frontal zone in a layer between 800-600 mb. Note also the low-level jet located at the top of the frontal zone.
12 hr eta forecast of divergence (purple lines, dashed negative) and wind speed (black lines) verifying at 1/7 00z.
The next figure shows the resultant vertical motion pattern along the same cross section. The favorable pattern of low-level convergence and upper level divergence results in a large, deep area of upward vertical motion extending across all of Pennsylvania. The upward vertical motion is quite deep, extending up through 300 mb. Also shown in the next figure is frontogenesis. Note that the maximum of frontogenesis slopes upward from south to north. Frontogenesis is typically maximized along frontal boundaries, and the sloping maximum in this figure shows the location of the front. Frontogenesis also induces a circulation with upward motion on the warm side of the frontogenesis, and downward motion on the cold side. The strength and shape of the circulation is dependant on the stability of the atmosphere on the warm side of the front, with unstable conditions favoring strong, steeply sloped circulations. In the figure below, note that the strongest values of upward vertical motion are indicated just on the warm side (just above) the frontal boundary.
12 hr eta forecasts of vertical motion (black lines, dashed means upward) and frontogenesis (purple lines) verifying at 1/7 00z.
To get a larger-scale look at the divergence pattern associated with this event, consider the long cross section of divergence and wind speed shown below. In this figure, the cross section extends from SYR to RDU. Two jets can be seen, one across the south, and one across the north. The line is oriented in such a way that the cross section was taken through the left exit region of the southern jet, and the right entrance region of the northern jet. The upper level divergence appears to be the result of a coupling of the circulations associated with these two jet streams. The mid-level divergence appears to be associated primarily with the right entrance region of the northern jet as it slopes downward to the south.
12 hr eta forecast of divergence (purple lines, negative dashed) and wind speed (black lines) verifying at 1/7 00z.
The cross section of frontogenesis shown earlier indicated that the strongest frontogenesis across Pennsylvania at 00z on the 7th occurred between 700 and 800 mb. The following figure is a plan view of frontogenesis at 800 mb at 00z on the 7th. In this case, the heavy snow bands over northeast and central Pennsylvania appeared to line up fairly well with the 800 mb frontogenesis.
12 hr eta forecast 800 mb frontogenesis verifying 1/7 00z.
To see why frontogenesis occurred in this region at 00z on the 7th, consider the forecast deformation and temperature fields, shown below. Note that the maximum of deformation occurred in the baroclinic zone where the frontogenesis was maximized. In this case, the deformation was primarily shear deformation, as opposed to stretching deformation. The shearing deformation appeared at the nose of the low-level jet, where a strong horizontal wind shear is evident.
12 hr eta forecast 800 mb deformation verifying 1/7 00z
12 hr eta forecast 800 mb temperature and wind verifying at 1/7 00z.
The shear deformation over central and northeast Pennsylvania formed as a result of a very strong southeasterly flow across southeast Pennsylvania impinging upon a light flow across northwest Pennsylvania. The following figure shows that the strong southeast flow was generated partially by a strong ageostrophic southerly flow across the area, which was likely induced by an area of divergence located above. Recall the earlier figure which showed a strong area of divergence in the mid-troposphere located just above a sloping frontal zone. Recall that the divergence appeared to be associated primarily with the right entrance region of an upper-level jet streak sloping downward toward the south.
12 hr eta forecast 500 mb divergence and 800 mb ageostrophic flow verifying at 1/7 00z.
To get a better idea of why narrow bands of extremely heavy snow fell across northeastern Pennsylvania, let’s look at the potential for slantwise convection with this system. The figure below is a 12 hr eta forecast of frontogenesis and EPV, verifying at 1/7 00z. A sloping region of frontogenesis is indicated, extending from south to north from Delaware to southern New York. A pronounced region of negative EPV is indicated across the far south near DOV. A second area of negative EPV is located from central Pennsylvania northward across New York state. The maximum associated with this area is in the mid-troposphere near the frontogenesis maximum, but the area of negative EPV extends northward through the lower troposphere below the frontal surface.
12 hr eta forecast of frontogenesis (purple) and EPV (black lines, only negative values plotted).
The figure below shows a 12 hour eta forecast of relative humidity and EPV verifying at 1/7 00z. Note that the entire area of negative EPV in the lower and mid-troposphere is collocated with relative humidity values of 90 percent or greater. This is an indication that the PSI indicated by the negative EPV could have been released across Pennsylvania.
12 hr eta forecast rh and epv (only negative values plotted) verifying at 1/7 00z.
The next figure shows a cross section of EPV and vertical velocity, verifying at 1/7 00z. Note the strong upward vertical velocity maximum associated with the negative EPV. The maximum of vertical motion is collocated with the maximum of negative EPV in the mid-troposphere (this area was also collocated with a maximum of frontogenesis).
The figure below shows an eta forecast cross section of theta-e and geostrophic momentum, verifying at 1/7 00z. Note that the static stability across the area above the sloping frontal zone is low relative to the stability in the frontal zone. However, there are no areas above the frontal zone where the stability even approaches neutral along the central and northern part of the cross section. (Some potential instability is implied along the southern part of the cross section just to the northwest of DOV). The main reason for negative EPV on this cross-section was that the geostrophic momentum surfaces were forecast to slope downward from south to north in the mid-troposphere above central Pennsylvania. This implies an inertially unstable condition, with negative absolute vorticity (absolute vorticity can be defined as -dMg/dx, where the x direction is perpendicular to the frontal zone). In other words, if an air parcel is displaced horizontally toward the north in this environment, its wind speed would be less than geostrophic, so it would have to accelerate horizontally, in the direction of the displacement (toward the north). A look at forecasts from the 00z eta model verifying at the same time and across the same cross section also indicated an area of inertial instability, located a bit farther south than what the 12z eta was forecasting
Cross section of geostrophic momentum and theta-e verifying 1/7 00z.
To see why the geostrophic flow was inertially unstable in this case, consider the data on the next two figures, which show the 700 mb height and geostrophic wind fields verifying at 1/7 00z. Note the sharp short-wave ridge downstream from the cut-off low pressure area, over central and northern Pennsylvania. Note also the sharp anticyclonic turning of the geostrophic wind in that region.
12 hr eta forecast 700 mb heights verifying 1/7 00z.
12 hr eta forecast 700 mb geostrophic winds verifying 1/7 00z.
The following figure shows the absolute vorticity of the geostrophic wind at 700 mb, verifying at 00z on the 7th. It can be shown that inertial instability occurs whenever the absolute vorticity is negative. In the real atmosphere, negative absolute vorticity is very rare, however it can sometimes be seen in the geostrophic flow. Note that in this case a band of negative absolute vorticity can be seen stretching from eastern New York across northeast Pennsylvania at 00 UTC on the 7th. This area of negative absolute vorticity corresponds to the sharp, small-scale ridging downstream from the 700 mb cutoff low shown in the previous figures.
12 hour eta forecast 700 mb absolute vorticity of the geostrophic wind verifying 1/7 00z.
In the real atmosphere, areas of intertial instability are quickly eliminated, as the resultant horizontal accelerations act to mix-out the strong horizontal wind shear responsible for the instability. The next two figures show 1) a cross section of non-geostrophic momentum surfaces and theta-e, verifying at 1/7 00z, and 2) 12 hr Eta forecast 700 mb absolute vorticity of the observed wind verifying at 1/7 00z. Note that, when the momentum surfaces are calculated from the real wind, they slope upward toward the cold air. As a result, a comparison between the slopes of these momentum surfaces and the theta-e lines indicates only neutral conditions for PSI, and no intertial instability. Note also that the area of negative absolute vorticity in the plot using the real winds has shrunk to only include a small section of southeast New York state. The absolute vorticity has become positive (indicating no inertial instability) over northeastern Pennsylvania.
12 hr eta forecast non-geostrophic momentum and theta-e verifying 1/7 00z
12 hr Eta forecast 700 mb absolute vorticity of the observed wind verifying 1/7 00z.
The final figure shows the advection patterns of theta-e along the plane of cross section from DOV to ELM. Note the strong warm advection along the frontal boundary, but little if any negative advection of theta-e above. No differential theta-e advection was forecast across the area where the negative EPV was forecast and the heavy snow band occurred. The result was relatively “flat” theta-e surfaces with this case, with little static instability.
12 hr eta forecast advection of theta-e verifying 1/7 00z.
What does this all mean in terms of what is really causing the instability manifested by the banded structures seen on the radar at 00 UTC on the 7th? There would seem to be a few possibilities: 1) The atmosphere truly is inertially unstable in this area, and the bands develop as parcels are accelerated horizontally. While accelerating horizontally toward the north, the bands are also forced upward, as they ascend the north-south sloped frontal surface. 2) The actual momentum surfaces in reality do not slope downward like what would be implied by the geostrophic momentum surfaces, but they do not slope upward as much as what are implied by the model forecast real-wind momentum surfaces. As a result, while the real atmosphere is not inertially unstable, it becomes unstable to slantwise ascent, as the theta-e surfaces slope upward slightly more than the momentum surfaces. 3) The real atmosphere is not necessarily unstable at all in this situation, but the sharp anticyclonic curvature of the height field is forcing an ageostrophic southerly flow (parcels cannot make the sharp anticyclonic turn to the east around the bend of the ridge, so they develop an ageostrophic southerly component). This enhanced southerly flow is forced up the frontal surface, resulting in small areas of enhanced lift and precipitation. Any of these possibilities suggest that the existence of a small-scale, sharply curved ridge downstream from an upper-level low may be a good place to look for banded precipitation.
SUMMARY:
The following appear to be the significant similarities between this case, and the case from January 19th, 2002:
1) Significant bands of moderate to heavy snow formed with each case.
2) A sloping band of frontogenesis occurred with each case, with the bands of heavy snow being located near the northern end of the frontogenesis.
3) The bands of heavy snow were located north of the large scale forcing for upward vertical motion, as indicated by the Q vector divergence fields.
4) There were indications of instability (CI in the case of 1/19, unknown in the case of 1/6) becoming co-located with the northern end of the frontogenesis in each case. Both instabilities could be identified by the existence of negative EPV.
The following appear to be the significant differences between this case, and the case from January 19th, 2002:
1) The 1/6 case was associated with a large area of light to moderate precipitation, with embedded narrow bands of very heavy snow. The 1/19 case was associated with a single, relatively broad band of moderate snow, with little precipitation occurring outside of the band.
2) The synoptic scale flow on 1/6 was associated with a strong, compact PV maximum moving northeast along the east coast, and resulting rapid cyclogenesis. The flow on 1/19 was associated with only a weak lobe of PV over the mid-Atlantic region, and weak cyclogenesis.
3) The 1/6 case was associated with a lower tropospheric temperature profile just below freezing (favorable for aggregation in the low levels), and a mid tropospheric profile ranging from –5 to –10 between 5000 and 10000 feet, with a warm layer. The 1/19 case had a lower tropospheric temperature profile just below freezing, but also had a mid tropospheric profile of around –15 between 5000 and 10000 feet (favorable for depositional growth in the mid-levels) and no warm layer. The later profile appeared to be more favorable for large liquid to snowfall ratios.
4) The 1/6 case appeared to be associated with deep, broad patterns of upward vertical motion and mid-to upper level divergence. The 1/19 case featured relatively shallow, narrow and weaker upward vertical motion and mid-level divergence.
5) The 1/6 case appeared to be associated with a single, sloping frontal surface that sloped upward from southeast to northwest. The 1/19 case appeared to be associated with two distinct frontal surface, one to the southeast, and a second mid-level front associated with the upper level jet, and associated with the heavy snow band.
6) There was less static (thermodynamic) instability above the frontal zone in the 1/6 case than there was in the 1/19 case. The negative EPV associated with the 1/6 case was primarily due to the fact that the geostrophic momentum surfaces sloped downward from south to north in a zone (indicating inertial instability). The orientation of the theta-e surfaces in the 1/6 case indicated that the atmosphere was not even close to conditional instability in the area where the heavy snow bands occurred. In the 1/19 case, the geostrophic momentum surfaces sloped upward from south to north, but there was a layer of neutral to slightly conditionally instable conditions above the frontal zone in the region where the heavy snow band occurred.
7) The negative EPV in the 1/6 case was associated with a deep layer of saturation. The negative EPV in the 1/19 case was associated with a sharp gradient of relative humidity, with saturation at the bottom of the layer, and dry conditions at the top. This difference resulted from the fact that strong differential advection of theta-e was occurring above the frontal zone in the 1/19 case (associated with a mid-level dry slot), while no differential theta-e advection occurred with the 1/6 case (dry slot located well to the southeast of the heavy snow bands).
8) In the 1/19 case, there was negative EPV all along the upward boundary of the sloping frontal zone. In the 1/6 case, the only negative EPV located above the sloping front was at the northern edge of the frontogenesis near a maximum of frontogenesis.
9) In the 1/6 case, there was a layer of implied PSI located within the lower-troposphere, within and beneath the sloping frontal zone, due to the unusual slope of the momentum surfaces in that zone. In the 1/19 case, there was no negative EPV within the frontal zone.
10) The deformation associated with the frontogenesis in the 1/6 event was primarily shear deformation, while the deformation associated with the 1/19 event was primarily from stretching deformation (confluence).