The March 9th - 10th Serial Derecho
By Mike Evans
A squall line of showers with embedded thunder and lightning moved rapidly east across central New York and northeastern Pennsylvania during the evening of March 9
th and the early morning hours of March 10
th. The line developed several bow echo segments as it moved east across the area, with wind gusts estimated at 60 mph. Downed trees and wires were reported in nearly every county across the BGM county warning area.
A Review Of Derechos
A derecho is defined as a convective wind-storm that occurs along a path length of at least 400 km (Johns and Hirt 1987). The damage reports must be continuous and non-random; ie widespread damage. A serial derecho is defined as a derecho associated with a strong, migratory low-pressure system. These types of derechos typically occur during the winter or early spring. A progressive derecho is defined as a system that occurs in west or northwest flow aloft and is frequently associated with weaker synoptic scale forcing. This type of convective system typically develops near or north of a warm front, then races off to the southeast through a very unstable warm sector. The favored time of year for a progressive derecho is late spring through summer.
Studies of warm season, weakly forced (progressive) derechos indicate that important factors for development include very high instability south of the warm front, and strong shear, especially in the lowest 2 km of the atmosphere. A source of mid-level dry air have also been found to be important for the development of a weakly forced, warm season derecho. Mid-level dry air leads to stronger (colder) cold pools, which can lead to the fast movement of the storms, even in the absence of strong mid-level winds.
Studies of cold season, strongly forced (serial) derechos indicate that those types of systems can occur with very limited instability. Shear and mean wind values are typically very large, and hodographs can often appear to be supportive of tornaodes (long, strongly curved hodographs). The presence of mid-level dry air is not as important in a strongly forced event as with a weakly forced event, but dry air can still play a role in strengthening the cold pool and increasing the wind speeds associated with the convection (Evans and Doswell 2001).
The tendency for hodographs to look similar for strongly forced derecho environments and tornado environments can often make forecasting the most likely dominant mode of convection difficult in situations with long, curved hodographs. Some modeling studies indicate that derechos are most favored when the strong shear is confined to the lowest 1 or 2 km of the atmosphere, while supercels are more favored when the shear is deeper (Weisman 1993). The hypothesis for this finding is that strong shear extending through the mid-levels of a storm results in strong rear-to-front storm relative wind flow increasing with height at mid-levels of the storm. This flow results in large amounts of precipitation being blown downstream away from the downdraft of the storm, which decreases the amount of cooling associated with the downdraft and decreases the amount of outflow at the surface. Storms that are less outflow-dominated at low-levels have a better chance to develop tornadoes, since strong outflows tend to stabilize the area underneath the updraft of the storm (Brooks et al. 1994).
Another helpful discriminator between derecho environments and tornadic environments may be the energy helicity index (EHI). Observational studies have shown that the EHI ((shear x cape) / 160000) is significantly larger in tornadic environments than in environments that produce derechos. A cut-off value of around 1.0 has been informally found to be a good value for our area. Recent observational studies also indicate that high boundary layer relative humidity is also a good indicator that the environment may be more favorable for tornadoes than strongly forced derechos (Evans and Doswell 2001).
March 9th and 10th
A quick look at the weather maps on March 9
th indicates that the severe convective event of March 9
th and 10
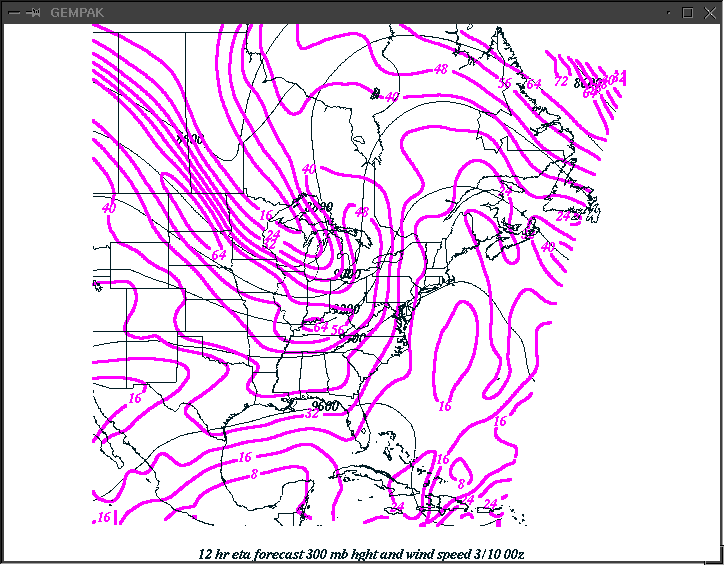
th was a strongly forced Derecho. The figures below show 12 hour Eta forecasts of the 300 mb wind speed and heights, 500 mb heights, surface pressure and 850 mb temperatures verifying at 0000 UTC on March 10
th. A major upper-level trough is moving east across the Great Lakes, with a very strong cold front moving east across the eastern Great Lakes.
|
|
12 hr Eta forecast 300 mb wind speed and heights verifying at 3/10 0000 UTC. Note the strong upper-level trough moving east across the Great Lakes, with two 64 m/s speed maxima, one at the base of the trough, and one on the west side of the trough.
|
|
|
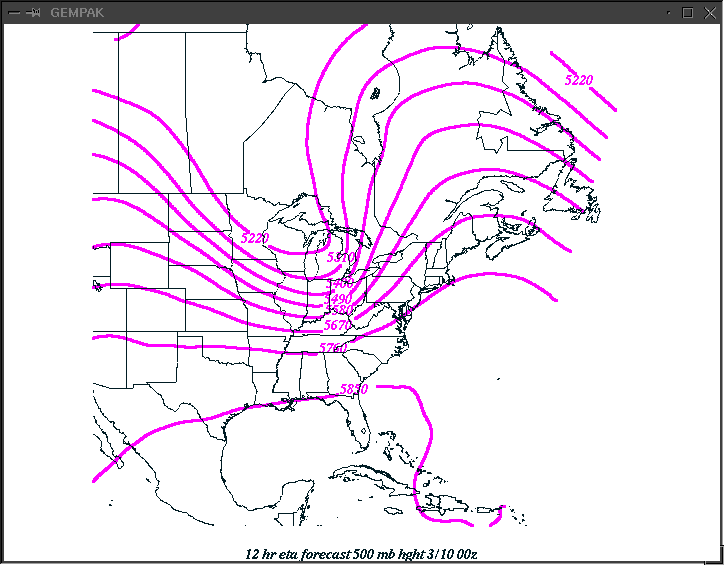
12 hr Eta forecast 500 mb heights verifying 3/10 0000 UTC. A strong trough is moving east across the Great Lakes.
|
|
|
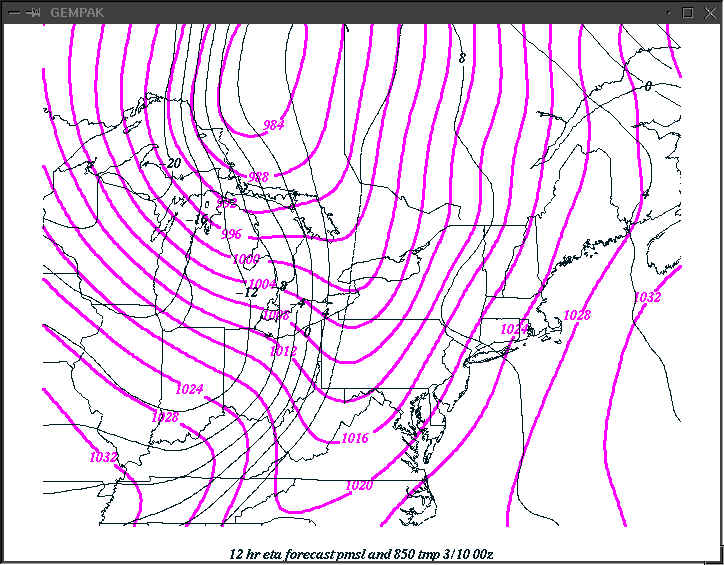
12 hr Eta forecast pmsl and 850 mb temperatures verifying at 3/10 0000 UTC. A strong cold front is moving east across western New York and western Pennsylvania.
|
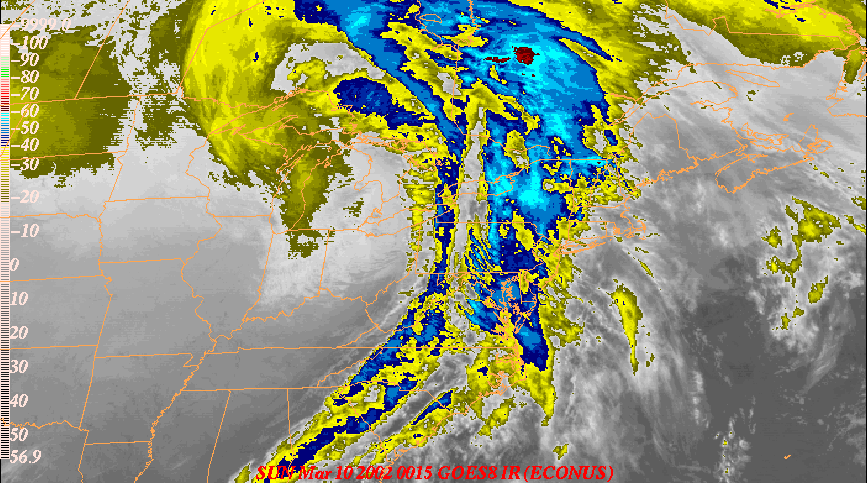
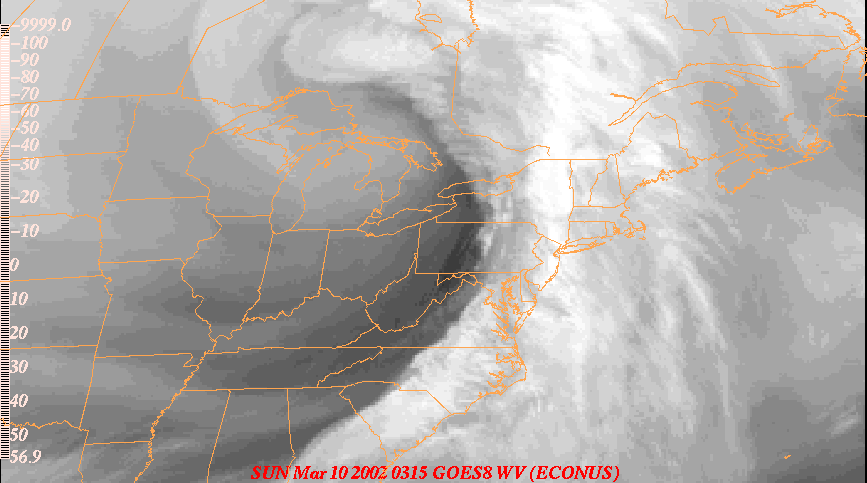
The following figures show IR and water vapor satellite imagery from March 9
th. Both images indicate a strong trough moving east across the Great Lakes area. The water vapor imagery in particular shows strong mid-level drying behind the squall line over western Pennsylvania and western New York at 0300 UTC on the 10
th.
|
|
IR satellite imagery at 0015 UTC on March 10th.
|
|
|
Water Vapor satellite imagery at 0315 UTC on March 10th.
|
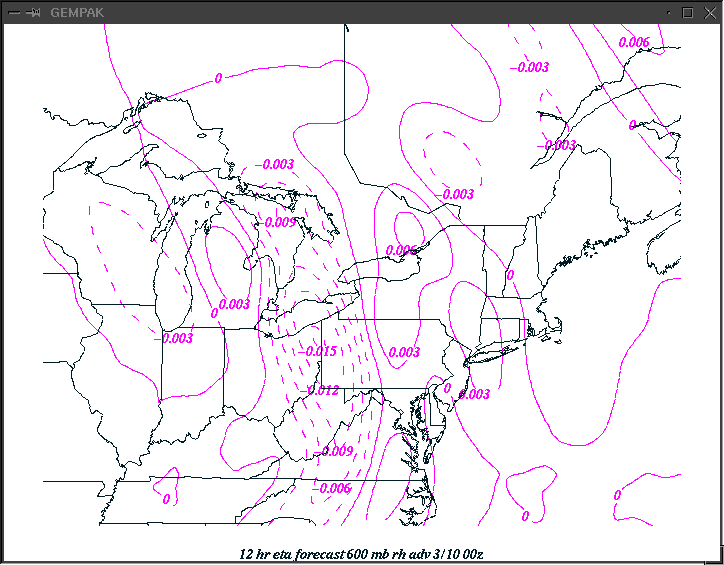
The following figure shows the 600 mb ETA forecast advection of relative humidity verifying at 0000 UTC on the 10
th. Note the strong advection of dry air into the back-side of the squall line.
|
|
12 hr Eta forecast advection of relative humidity at 600 mb verifying 3/10 0000 UTC.
|
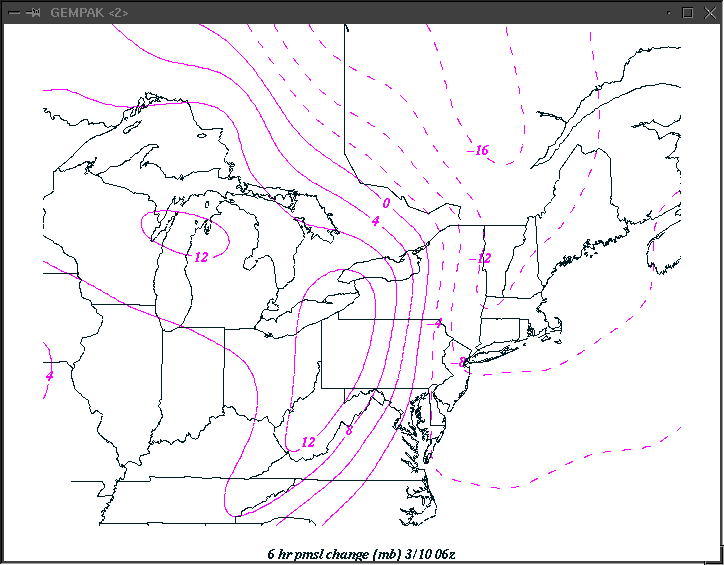
The next figure shows the ETA 12 hr forecast 6-hour pressure tendencies across the Great Lakes and northeast verifying at 0600 UTC on the 10
th. Note the strong rise-fall couplet associated with the front as it moves east across the eastern Great Lakes. Strong rise-fall couplets of surface pressure tendency are a good indication of strong winds, as they lead to strong isallobaric wind components pointing in the direction from the rises toward the falls.
|
|
18 hr Eta forecast 6 hour surface pressure change verifying at 3/10 0600 UTC.
|
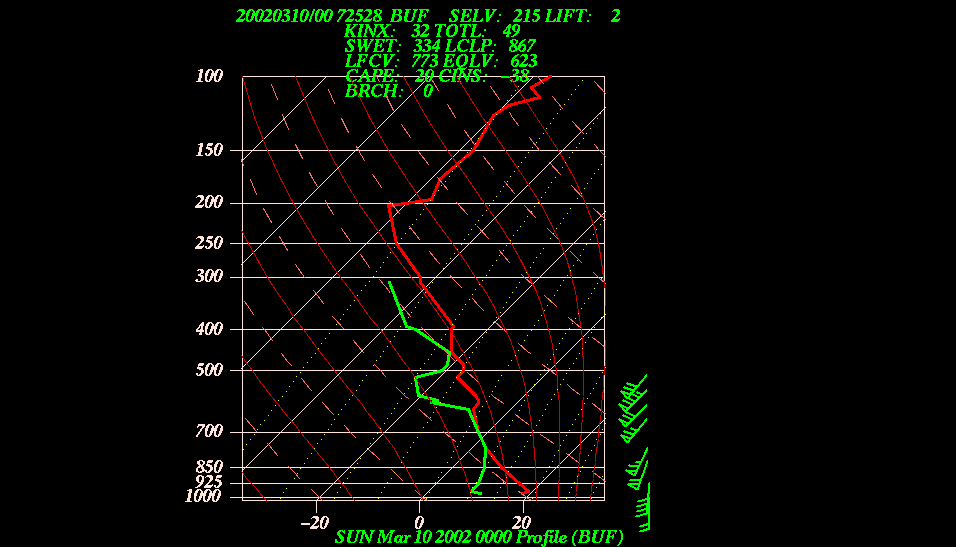
The following figure shows the observed sounding at Buffalo, NY at 3/10 0000 UTC. Note the very strong winds just above the surface indicated by this sounding (40 kts at 925 mb and 60 kts at 850 mb). The strong winds just off the surface of the ground were available to mix to the surface with any convection that developed. Model forecast soundings (shown later in this document), indicated that 60 kt winds may have been present as close as 1000 feet above the surface. Another feature of note on this sounding was the inverted V signature evident in the lowest 3 km of the sounding, and the layer of dry air evident in the mid-levels of the sounding. Both of those features would have been favorable for evaporational cooling within the downdrafts of any convection, and therefore would have been favorable for the production of enhanced wind gusts. In this case however, the production of enhanced winds by evaporational cooling within convective downdrafts was probably of secondary importance compared to the convective mixing of the strong environmental winds to the surface.
|
|
Observed Buffalo sounding at 3/10 0000 UTC.
|
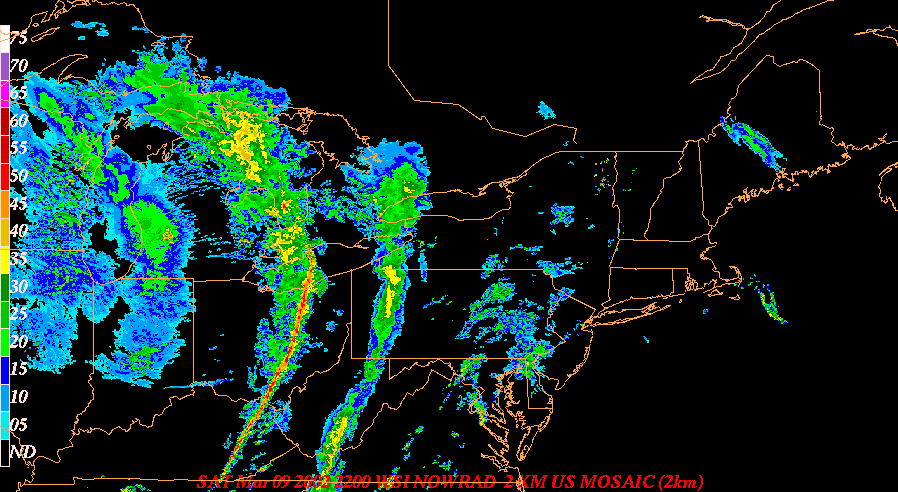
The following figures show composite radar imagery over the Great Lakes and northeast as the squall line moved east across the area. Clearly, convection occurred and would have been able to mix the strong winds shown in the previous figure down to the surface. This mixing of very strong low-level winds to the surface was likely the primary mechanism for the production of the damaging winds. The squall line appeared to weaken slightly as it moved across Lake Erie, then strengthen as it continued to move east across western New York and western Pennsylvania.
|
|
Composite radar reflectivity at 2200 UTC, March 9th, 2002.
|
|
|
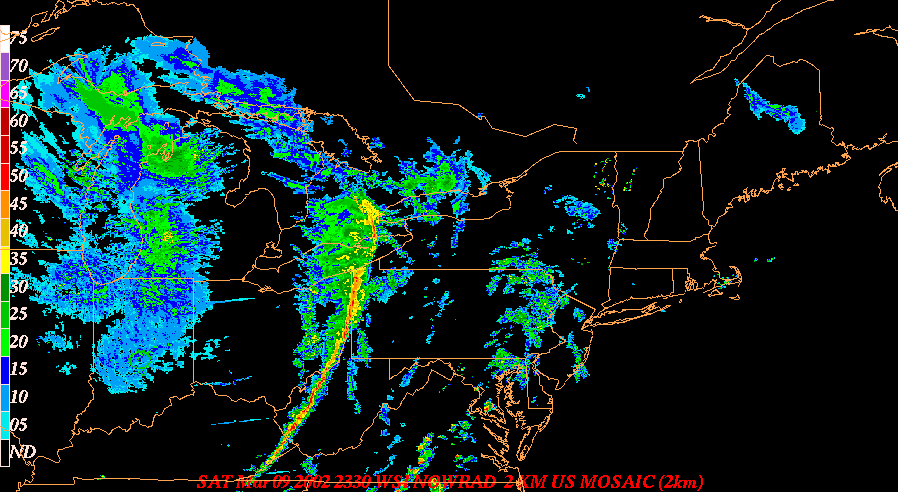
Composite radar reflectivity at 2330 UTC, March 9th, 2002.
|
|
|
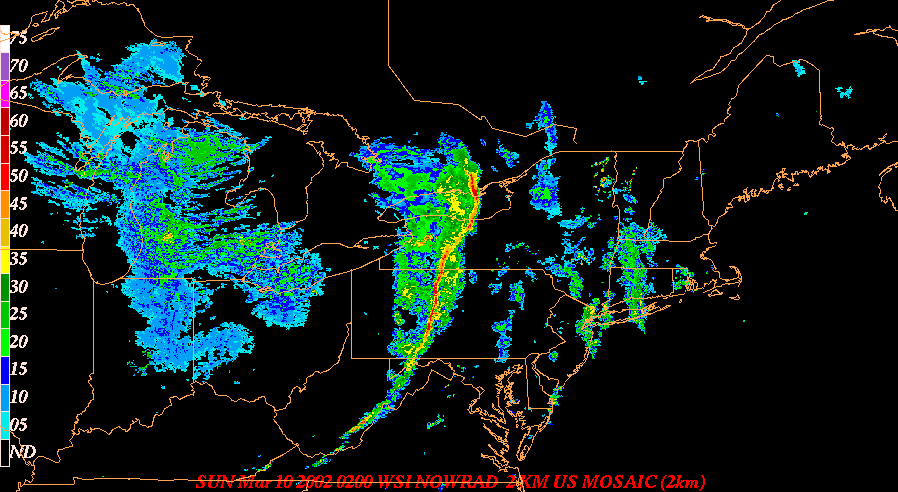
Composite radar reflectivity 0200 UTC, March 10th, 2002.
|
|
|
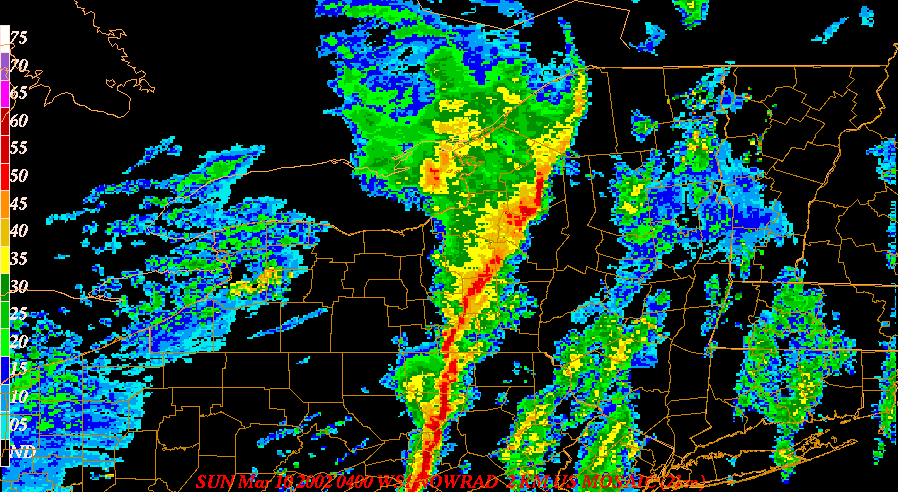
Composite radar reflectivity 0400 UTC, March 10th, 2002.
|
|
|
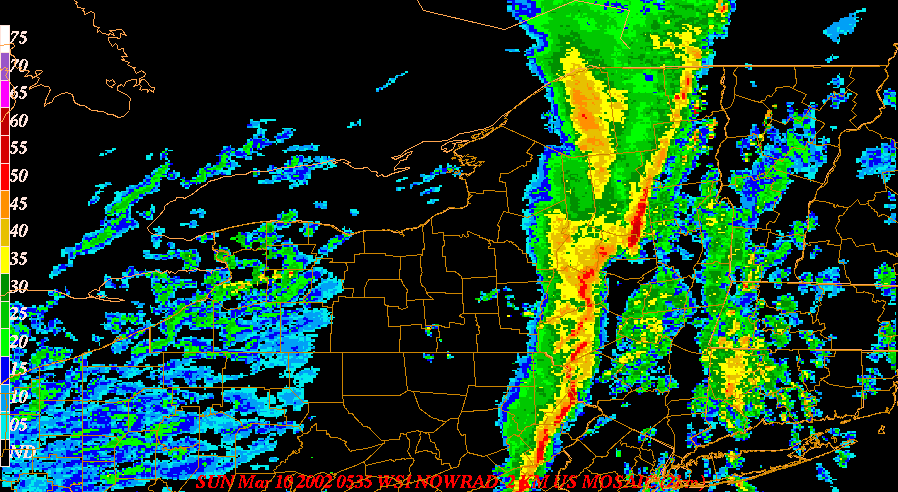
Composite radar reflectivity at 0535 UTC, March 10th 2002.
|
A close look at the last couple of radar images, indicates that the line developed several small-scale bow echoes as it moved across central New York and northern Pennsylvania. The bow echoes can be identified as areas where the higher reflectivity bowed out ahead of the main line, with channels of weaker reflectivity developing behind the bow. A good example can be seen at 0535 UTC on the 10
th, over southeastern Otsego county. Breaks in the line can also be seen in some areas, as the weak echo channels punch through the line. These bow echoes and breaks in the line were all locations where enhanced wind gusts likely developed, and caused damage.
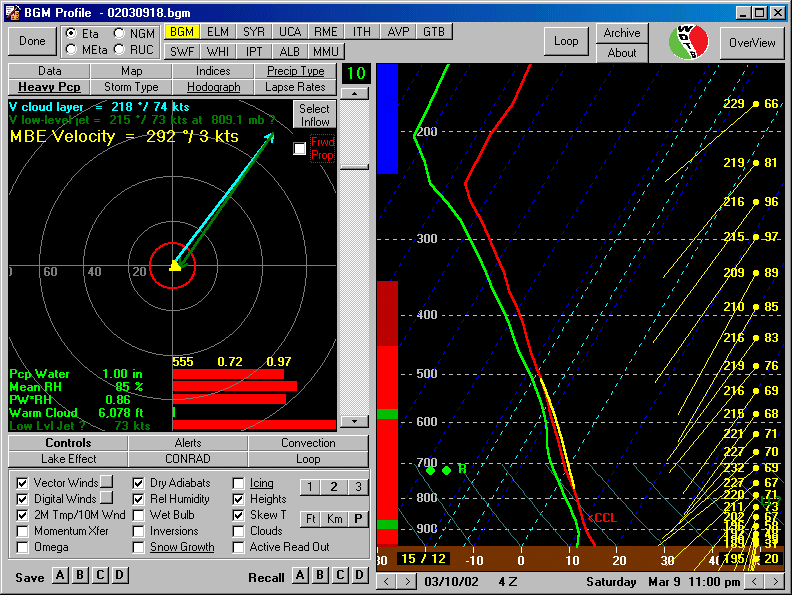
The squall line shown in the last few figures was moving toward the east-northeast at approximately 50 kts. The following figure shows a BUFKIT forecast sounding taken at BGM from the 18 UTC run of the Eta model. The MBE (meso-beta element) velocity vector indicated by the figure is toward the east at 3 kts. (Recall that MBE vectors are the vector sum of the mid-level flow (advection of individual cells within the convective system), and the negative of the low-level flow (an indication of where new cells are likely to form). The resulting MBE vector is supposed to give a first guess estimate of system motion). Clearly, this is a classic example of why MBE vectors do not always give a good estimate of storm motion, especially in uni-directional flow in outflow-dominated storms. In this case, with strong, nearly uni-directional flow, MBE vectors will be small, as the mid-level flow and the negative of the low-level flow will nearly cancel.
|
|
BUFKIT sounding at BGM from the 18/09 run of the Eta, verifying at 0400 UTC, 3/10. The MBE vector calculation in this case is not accounting for a forward propagating storm.
|
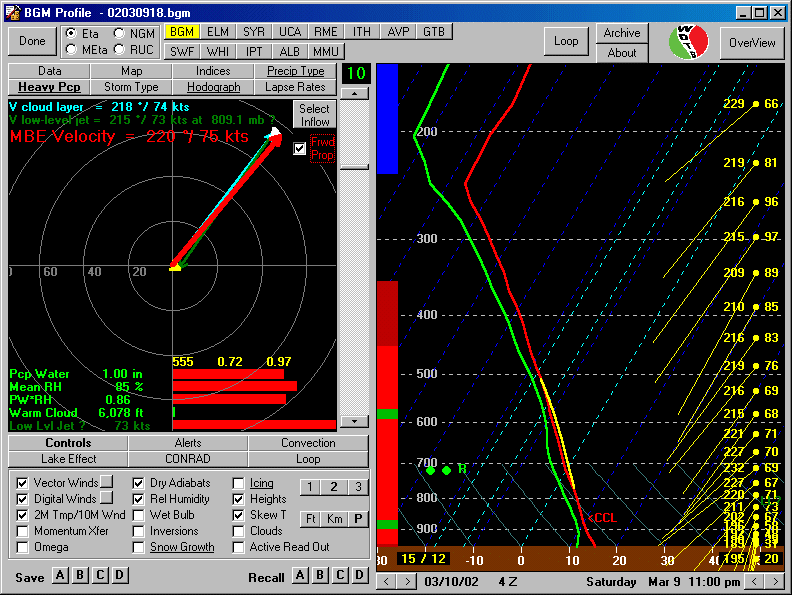
In cases with strong uni-directional flow, when storms are expected to injest dry-air in the mid-levels and develop strong cold pools, they typically become forward propagating storms, in the sense that the best storm relative inflow typically develops on the forward, or downwind, side of the cold pool. In that case, use of the MBE vectors in BUFKIT to estimate storm motion will be seriously misleading. An option is available in BUFKIT to estimate the storm motion for a forward propagating storm. The figure below shows the storm motion estimate from BUFKIT, after using the forward propagating option. Note that the estimate is now 75 kts toward the northeast, quite a difference from the 3 kts shown on the previous figure! Note also that the indicated movement toward the northeast was still not a very good estimate of system movement, as the system in this case moved almost due east. The reason for the more eastward movement of the system in this case may have been that the synoptic-scale forcing for upward motion was moving toward the east.
|
|
BUFKIT sounding at BGM from the 18/09 run of the Eta, verifying at 0400 UTC, 3/10. The MBE vector calculation in this figure is now accounting for a forward propagating storm.
|
Clearly, this event developed as a well-organized squall line, or serial derecho, with embedded bow echoes, in the presence of strong forcing. The question then becomes, how well did the environment with this event match environments typically associated with strongly forced derechos, as specified in the introduction of this study?
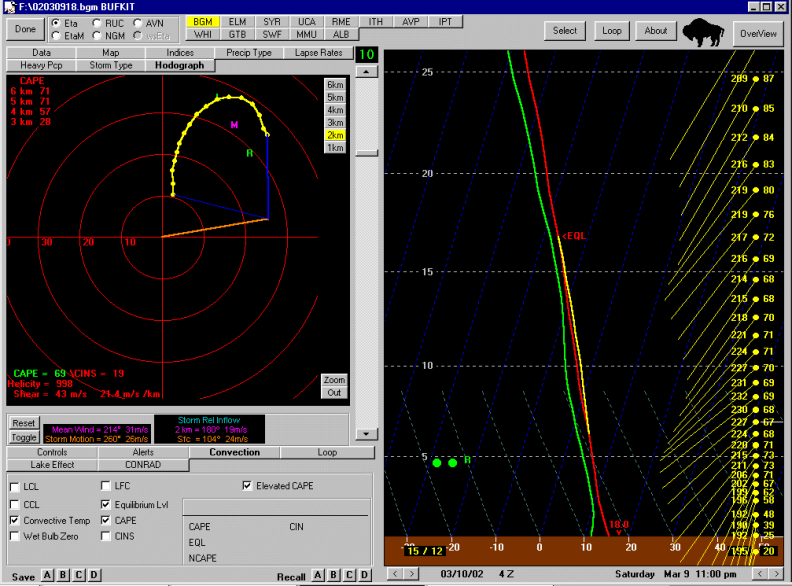
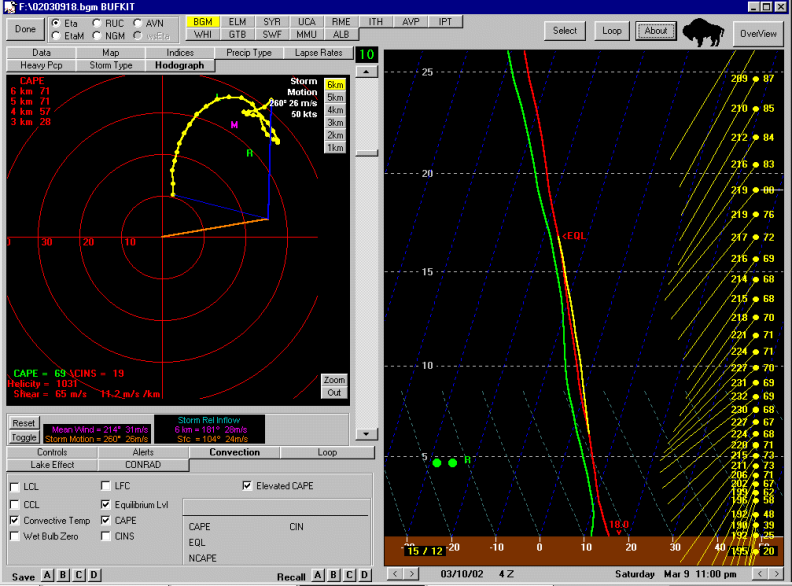
The next two figures show BUFKIT forecast soundings, with hodographs, at BGM verifying at 11 PM, on March 9
th. In the first figure, the hodograph shown is for the lowest 2 km of the atmosphere. Note the strong shear (43 m/s) indicated in the lowest 2 km. The second figure shows a hodograph for the lowest 6 km of the atmosphere. Note that most of the shear with this event was in the lowest 2 km, as the hodograph becomes much shorter and disorganized above 2 km. Recall that this may be favorable for weak storm relative inflow in the mid-levels of the storm, which would then be favorable for outflow-dominated storms. Note also that BUFKIT is estimating a storm relative inflow for this case of 23 m/s from the east at the surface, and just 14 m/s from the south at 6 km. A light southerly storm relative flow at the mid-levels of this convective system would have resulted in almost no rear-to-front storm relative flow, since the rear of this north-south line of storms would have been the west side of the line. Storms with strong storm relative inflow at low-levels and weak rear-to-front storm relative flow at mid-levels are typically outflow dominated, forward propagating storms. That would be the typical storm expected with a derecho.
|
|
BUFKIT forecast sounding for BGM from the 18/09 Eta, verifying at 0400 UTC, March 10th. Hodograph is from the surface through 2 km.
|
|
|
BUFKIT forecast sounding for BGM from the 18/09 Eta, verifying at 0400 UTC, March 10th. Hodograph is from the surface through 6 km.
|
Summary
The severe convective squall line on the evening of March 9th can be classified as a classic strongly-forced serial derecho. The strong forcing was supplied by a pronounced mid and upper level trough, and its associated surface cold front. The large-scale winds associated with this event were produced by a combination of the strong pressure gradient associated with the front, and a strong westerly isallobaric wind component associated with a pronounced fall-rise pressure couplet along the front. Wind damage occurred when more localized, damaging gusts were produced by convection associated with numerous fast-moving bow echoes along the squall line. The convection was able to tap the very strong wind fields located just above the ground, mixing those winds down to the surface. In addition, large amounts of dry air were advected into the back edge of the squall line by the large-scale wind field, which could have led to enhanced evaporation in the downdrafts of the storm, and enhanced winds. Some dry air was also evident in the low-levels of the environment, which would also have acted to increase cooling and wind production associated with thunderstorm downdrafts.
The environment associated with this event was typical of environments associated with strongly forced derechos. The event was associated with very strong wind shear, with the majority of the shear located in the lowest 2 km of the atmosphere. The instability was weak. The environmental storm-relative inflow was strong in the low-levels of the storm and weak in the mid-levels, resulting in a forward propagating, outflow dominated convective system. The result was widespread convective straight-line wind damage, but no tornado reports.