WFO BGM LOCAL CASE STUDY - JULY 21, 2003 SEVERE WEATHER OUTBREAK.
Isolated severe thunderstorms developed over the western Catskill mountains
during the early afternoon on the 21st, with one storm producing significant
wind damage in a campground in Delaware county. Later in the day, a large
line of severe thunderstorms developed, producing widespread wind damage
across central New York and northeast Pennsylvania. An F3 tornado was
confirmed in Potter county, in north central Pennsylvania just to the
southwest of the BGM CWA. In the BGM CWA, damage was mostly due to
straight-line winds, however an F1 tornado was verified in Sullivan county,
New York.
Figure 1a shows a 6-hour Eta forecast of 250 mb heights and wind speeds,
valid at 18 UTC on the 21st. A trough is indicated over the Great Lakes,
with a speed maximum forecast over southeastern Canada, and a second speed
maximum over the northern plains of the United States. Central New York
and northeast Pennsylvania are in the right entrance region of the speed
maximum over southeast Canada. Figure 1b shows an Eta 12-hour forecast of
250 mb heights and wind speed valid at 00 UTC on the 22d. The upper trough
had amplified slightly over the Great Lakes, with central New York remaining
in the right entrance region of the upper level jet streak over southeast
Canada and northern New England.
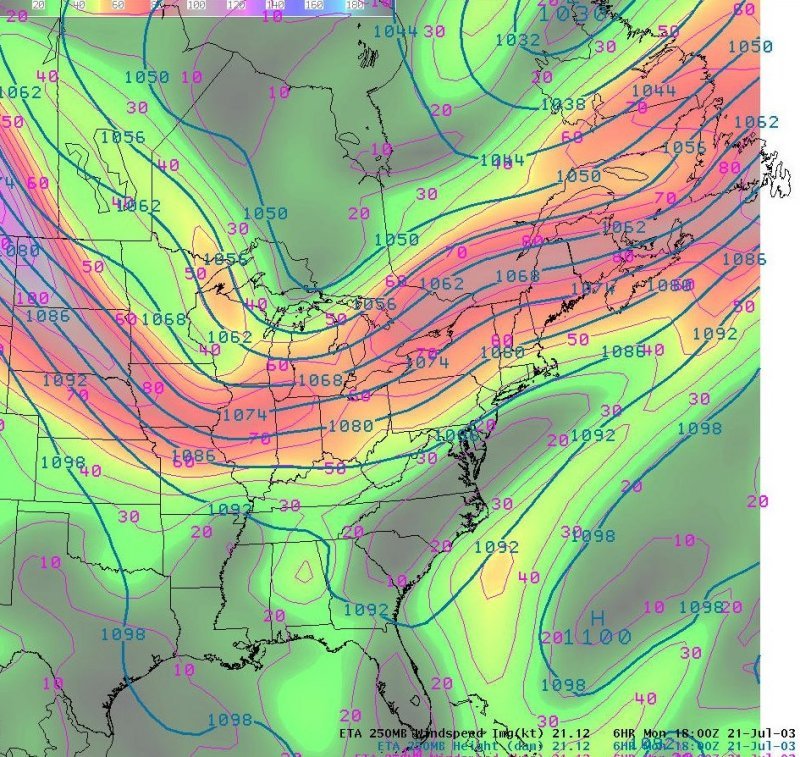
Figure 1a. 6-hour Eta forecast 250 mb heights and wind speed valid 18 UTC on
the 21st.
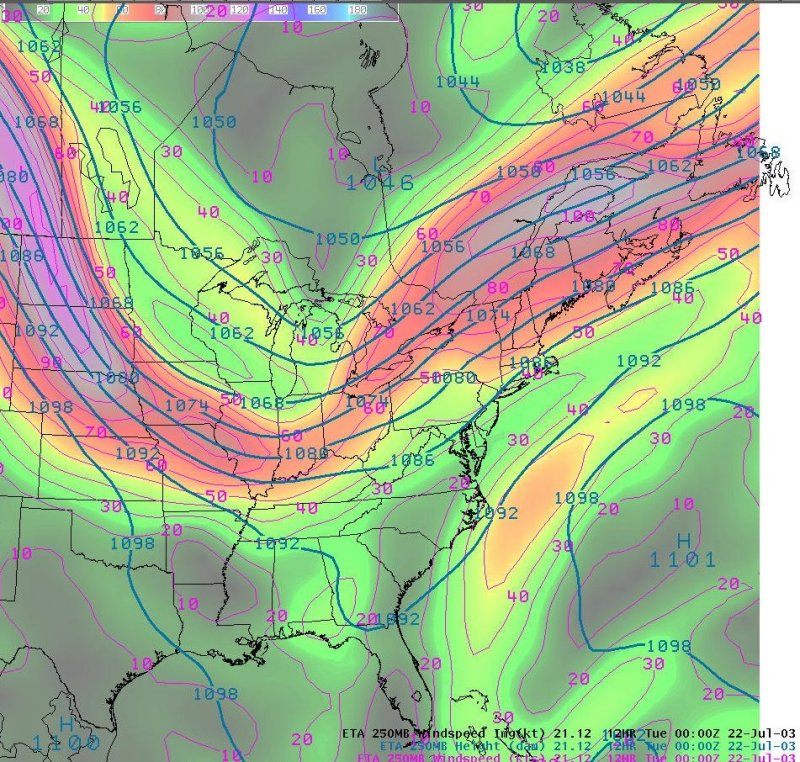
Figure 1b. 12-hour Eta forecast 250 mb heights and wind speed valid 00 UTC
on the 22d.
Figures 2a and b show Eta 6 and 12-hour forecasts of 500 mb heights and
vorticity valid at 18 UTC on the 21st and 00 UTC on the 22d. A sharp trough
is forecast over the Great Lakes, with a vorticity maximum forecast over
northeast Ohio at 18 UTC on the 21st. The vorticity maximum was forecast
to weaken and move northeast by 00 UTC on the 22d, with 500 mb heights not
forecast to fall over Pennsylvania and New York. The forecast of no height
falls, plus a weakening mid-tropospheric vorticity maximum in a southwest
flow aloft were all considered to be negative factors regarding the
potential for the development of severe weather. Severe weather across
central New York and northeast Pennsylvania is most often accompanied by
significant height falls and a northwest flow aloft.
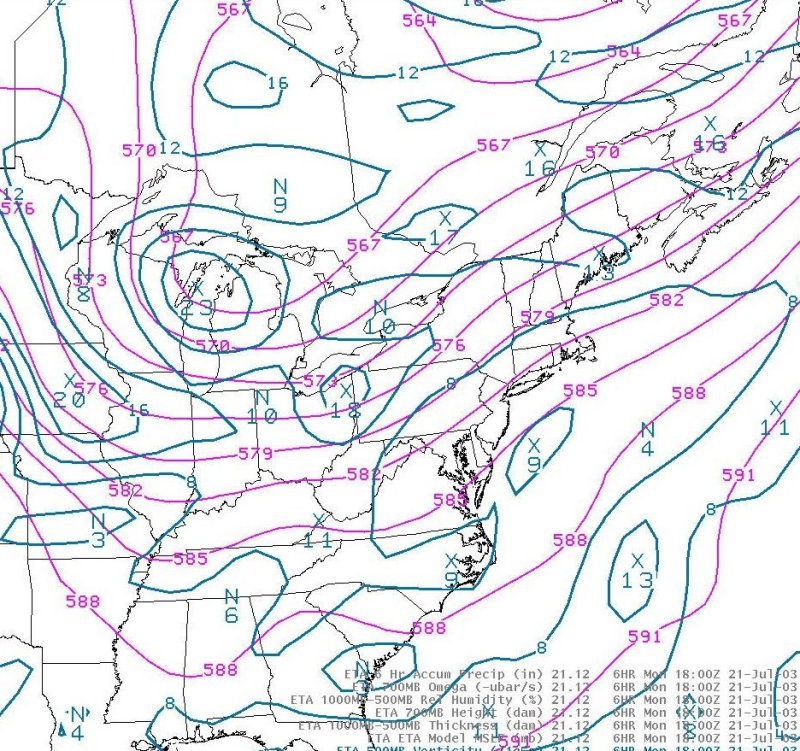
Figure 2a. 6-hour Eta forecast 500 mb heights and vorticity valid 18 UTC on the
21st.
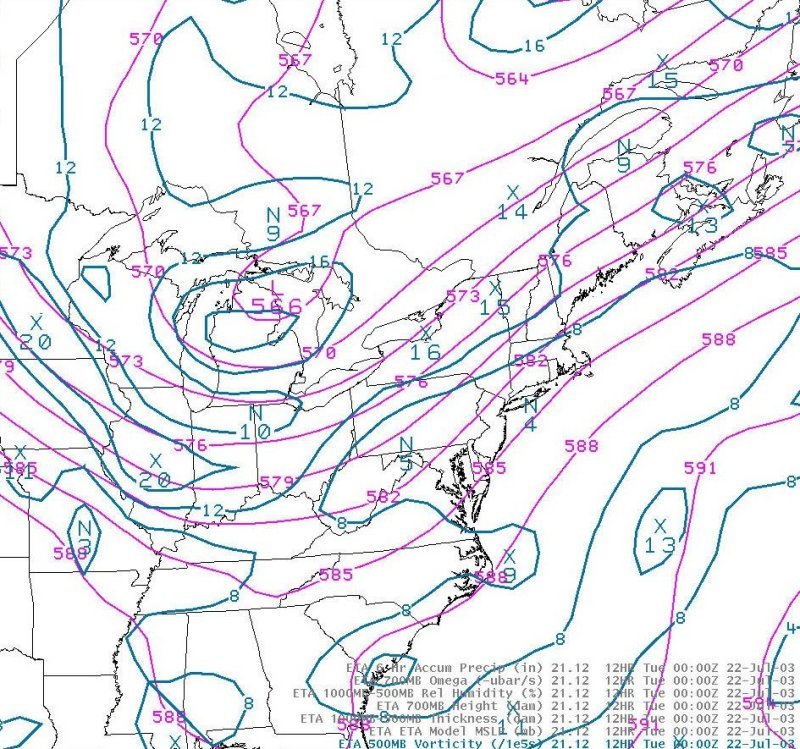
Figure 2b. 12-hour Eta forecast 500 mb heights and vorticity valid 00 UTC on
the 22d.
Figures 3a and b show 6 and 12-hour Eta forecast mean sea-level pressure
valid at 18 UTC on the 21st and 00 UTC on the 22d. Surface low pressure
was forecast to move east across the Great Lakes during this time, with a
south to southeast flow gradually shifting to south-southwest across central
New York and northeast Pennsylvania. Subtle troughing in the forecast
surface pressure pattern indicated the possibility that a weak
warm-frontal-like feature would move north from southern Pennsylvania
through central New York late in the day, as winds shifted from the
southeast to the southwest. The surface cold front was forecast to remain
well to the west of the area through 00 UTC on the 22d.
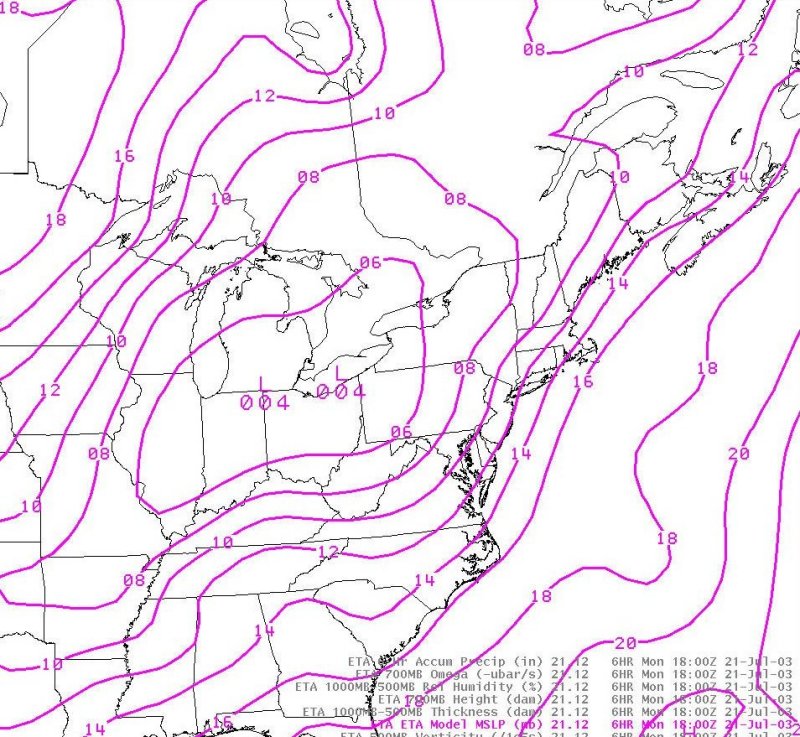
Figure 3a. 6-hour Eta forecast mean sea-level pressure valid 18 UTC on the
21st.
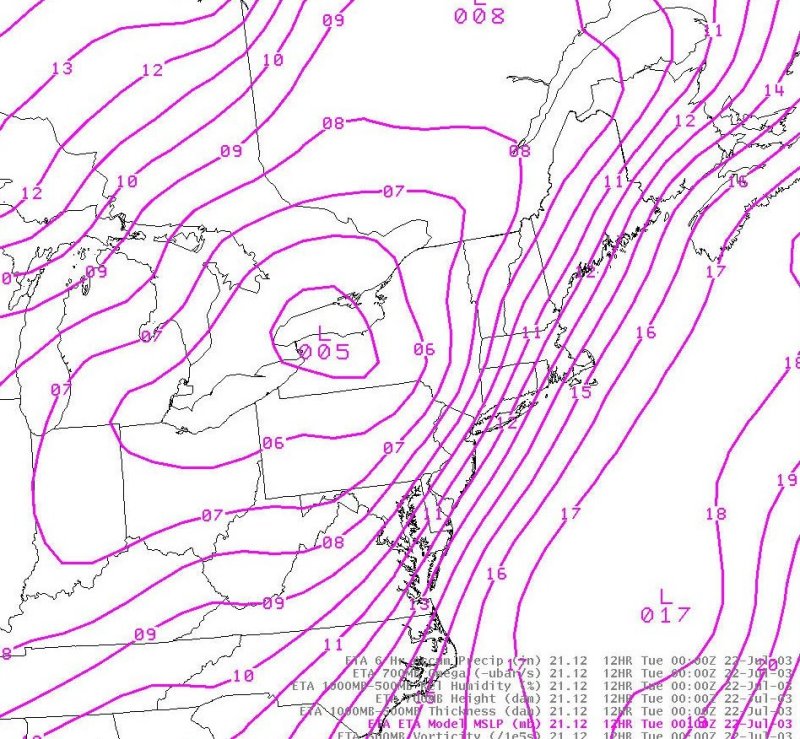
Figure 3b. 12-hour Eta forecast mean-sea level pressure valid 00 UTC on the
22d.
Figure 4 shows a 12-hour Eta forecast of equivalent potential temperature
convergence, valid at 00 UTC on the 22d. A pronounced maximum is indicated
over central New York. This maximum was associated with a maximum of
equivalent potential temperature, and low-level convergence associated with
the northward moving warm front (not shown). Eta forecast omega (not shown)
was also maximized over central New York at 00 UTC on the 22d, in the same
location as the maximum of equivalent potential temperature convergence.
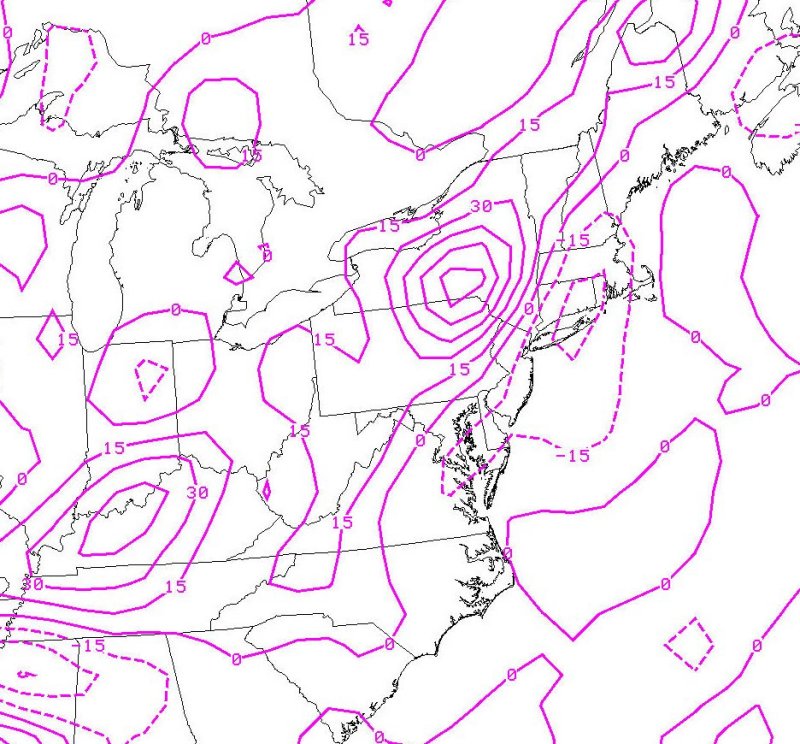
Figure 4. 12-hour Eta forecast 925 mb theta-e convergence valid 00 UTC on the 22d.
Figure 5 shows the 6-hour Eta forecast 500 mb relative humidity and wind, valid at
18 UTC on the 21st. A pronounced tongue of dry air is forecast across the Ohio Valley
at 18 UTC, with a strong southwest flow advecting the dry air toward Pennsylvania and
New York. This was an indication that there would be the potential for some mid-level
dry air to become injested by any convection that would develop across the area during
the afternoon. The result would be an enhanced cold pool, and an increased chance for
strong surface winds.
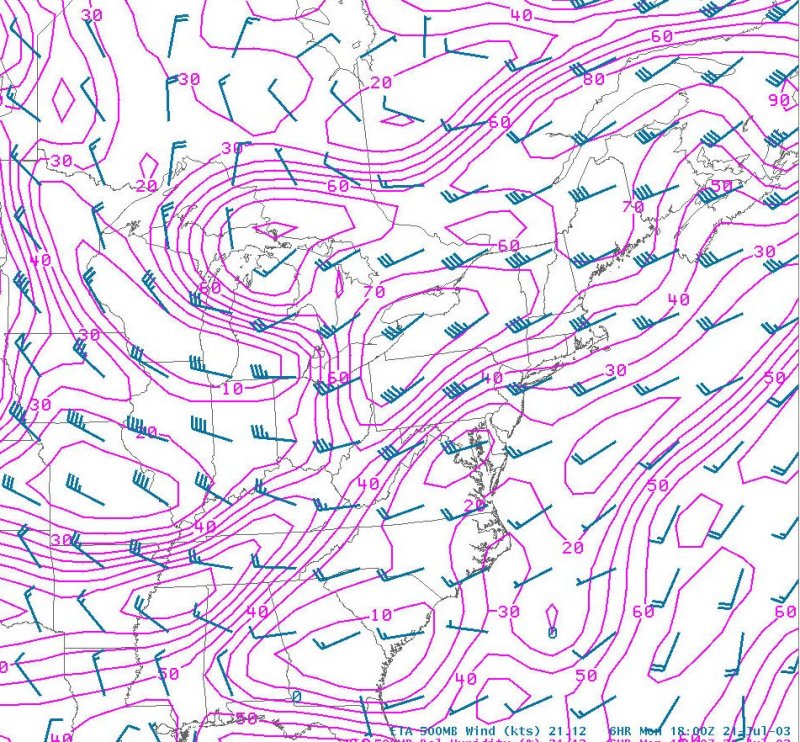
Figure 5. A 6-hour Eta forecast of relative humidity and wind speed, verifying at 18 UTC
on the 21st.
Figure 6a shows the 12-hour Eta forecast surface-based CAPE and 0-6 km shear
vectors, valid at 00 UTC on the 22d. CAPE values between 1000 and 1400 J/kg
are indicated, along with shear values between 30 and 40 kts. Both of these
values would normally be considered large enough for severe weather, but
just barely. Figure 6b shows the Eta 12-hour forecast surface and 700 mb
winds that resulted in the shear. The shear resulted from southerly surface
winds at 10 to 15 kts, and southwesterly 700 mb winds at 40 to 50 kts.
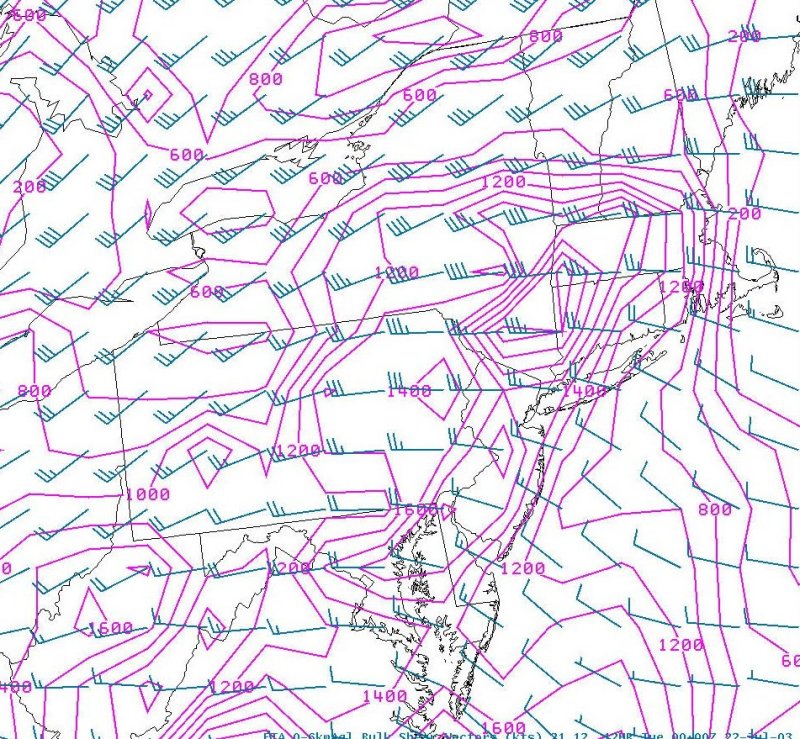
Figure 6a. 12-hour Eta forecast 0-6 km shear vectors and CAPE valid 00 UTC.
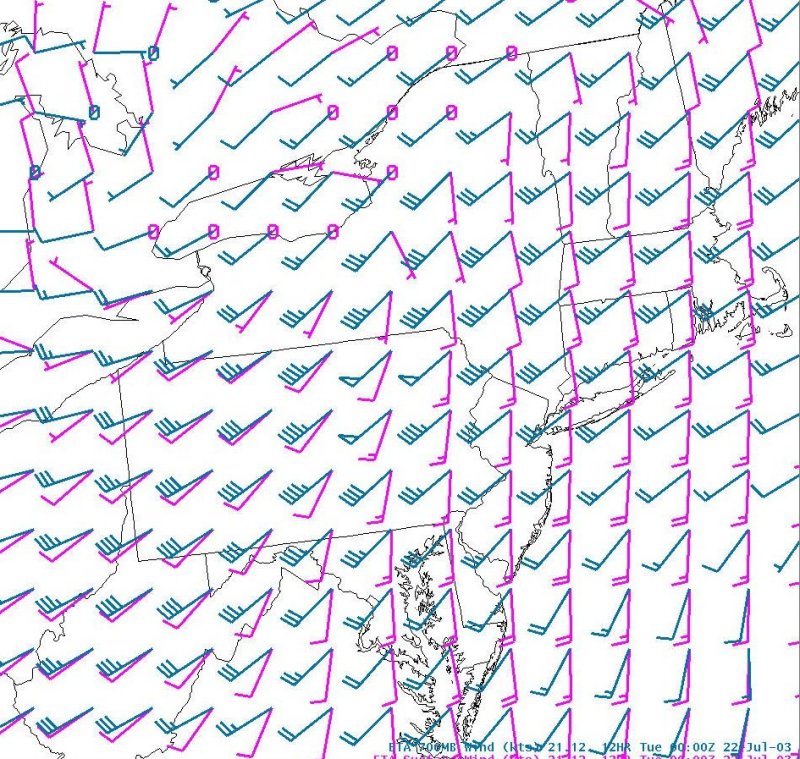
Figure 6b. 12-hour Eta forecast 700 mb and surface winds valid 00 UTC.
Figures 7a-c show a series of Eta forecast soundings, displayed by BUFKIT at
BGM, and valid at 19 UTC on the 21st. 19 UTC was selected for the time of
these displays, since the Eta model's convective scheme triggered by 20 UTC,
which degraded the temperature and dew point profiles of the sounding. The
forecast hodograph (Figure 7a) indicated anticyclonic turning from the
surface through 6 km. The majority of the shear was in the lowest 2 km
(recall that shallow shear favors outflow dominated storms, ie. convective
lines, while deeper shear favors mesocyclones and tornadoes) . The
anticyclonic turning and moderately strong shear resulted in a helicity
value of 233. The mid-level (6 km) storm relative flow was 12 m/s, high
enough to support at least a limited chance of tornadoes (the threshold
cited in previous research is 10 m/s). The forecast LCL was near 1 km,
which is near the threshold value favorable for tornadoes (less than 1 km
is best). The MBE vector for a forward propogating system (Figure 7b) was
from the west-southwest at 54 kts, indicating that storms that on this day
would have the potential to move quickly. The storm type display (Figure 7c)
indicated that the forecast bulk shear on this day was marginally strong
enough to support multicells or supercells, however the low forecast CAPE
values would be a negative factor regarding severe weather.
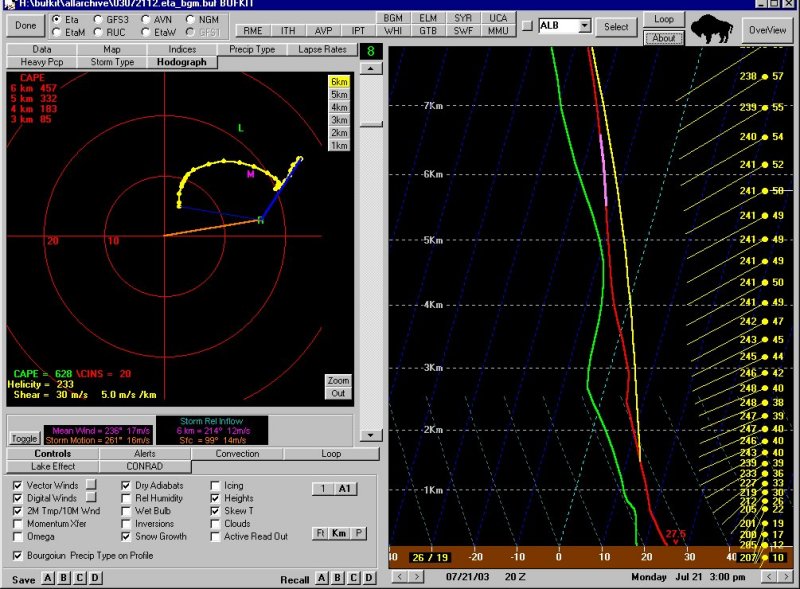
Figure 7a. 8-hour Eta forecast sounding, with hodograph, at BGM valid 20
UTC on the 21st.
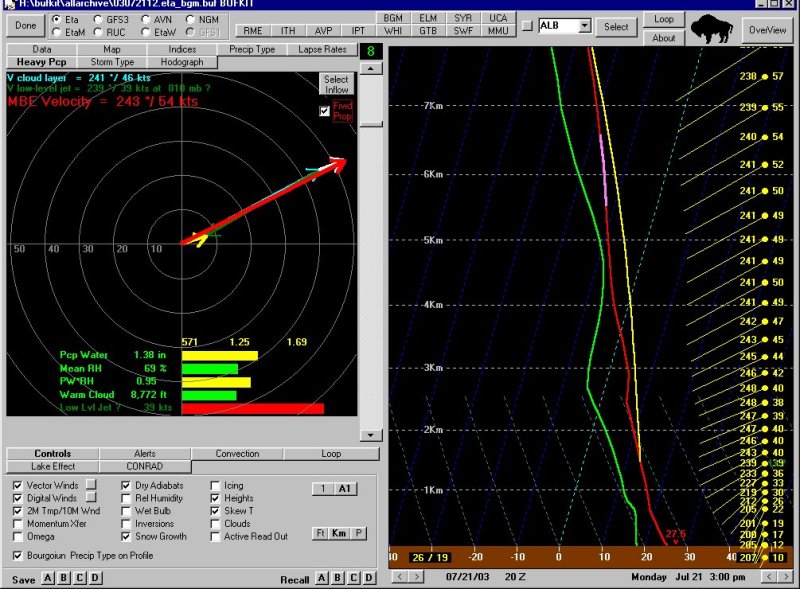
Figure 7b. 8-hour Eta forecast sounding at BGM, with MBE vectors, valid at 20 UTC
on the 21st.
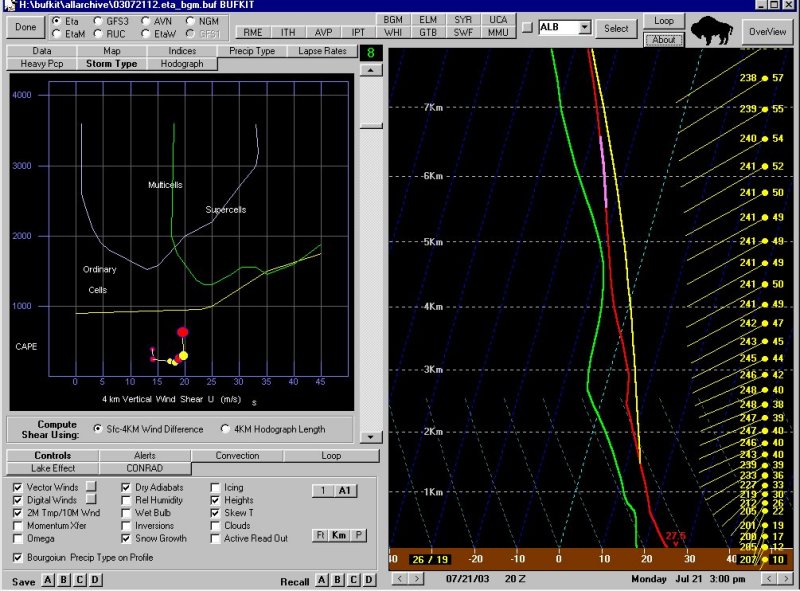
Figure 7c. 8-hour Eta forecast sounding, with a storm-type graph, at BGM valid 20
UTC on the 21st.
In summary, the 12 UTC Eta model was forecasting many signals for a potential severe
weather outbreak on this day, including moderately strong forcing and shear, and a
source of dry air at mid-levels. LCL heights and the strength of the mid-tropospheric
storm relative winds indicated at least some potential for tornadoes, however the fact
that much of the shear was forecast in the lowest 2 km indicated that a line of outflow
dominated storms was most favored. Negative factors for severe weather included limited
instability, a forecast weakening of the mid-level vorticity maximum, lack of height
falls, and a southwest flow aloft.
Figures 8a-b show 500 mb heights and vorticity forecast by the 16 UTC run of
the RUC model, valid at a) 18 UTC on the 21st, and b) 00 UTC on the 22d.
Compared to the Eta forecasts (Figures 2a,b), the RUC was forecasting a
stronger vorticity maximum to move across upstate New York, with more
associated height falls.
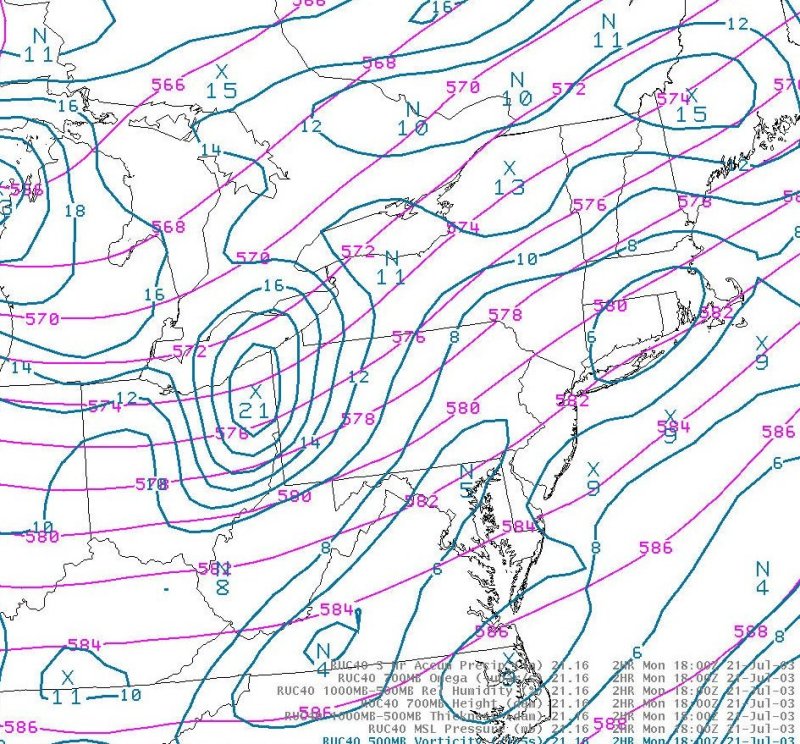
Figure 8a. 2-hour RUC forecast 500 mb heights and vorticity valid 18 UTC on
the 21st
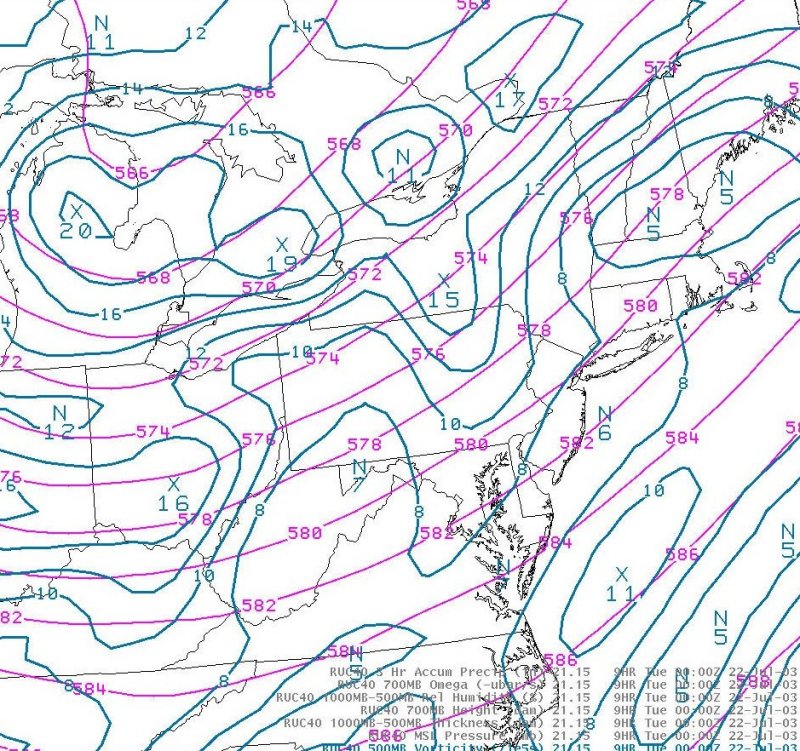
Figure 8b. 9-hour RUC forecast 500 mb heights and vorticity valid 00 UTC on
the 22d.
At the surface, the fact that the RUC was forecasting a deeper upper-level
trough and more height falls translated to less low pressure over the
eastern Great Lakes, and more low pressure further to the south, over the
eastern Ohio Valley (Figure 9a). As a result, the theta-e convergence,
forecast over central New York by the 12 UTC run of the Eta, was forecast
farther south, over Pennsylvania (Figure 9b).
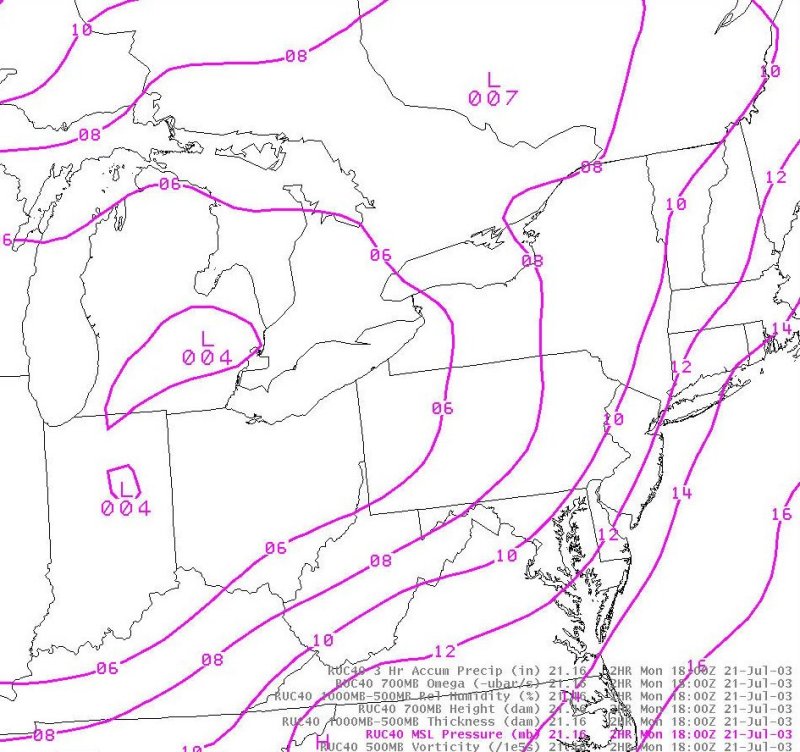
Figure 9a. 5-hour RUC forecast mean sea-level pressure valid 21 UTC on the
21st.
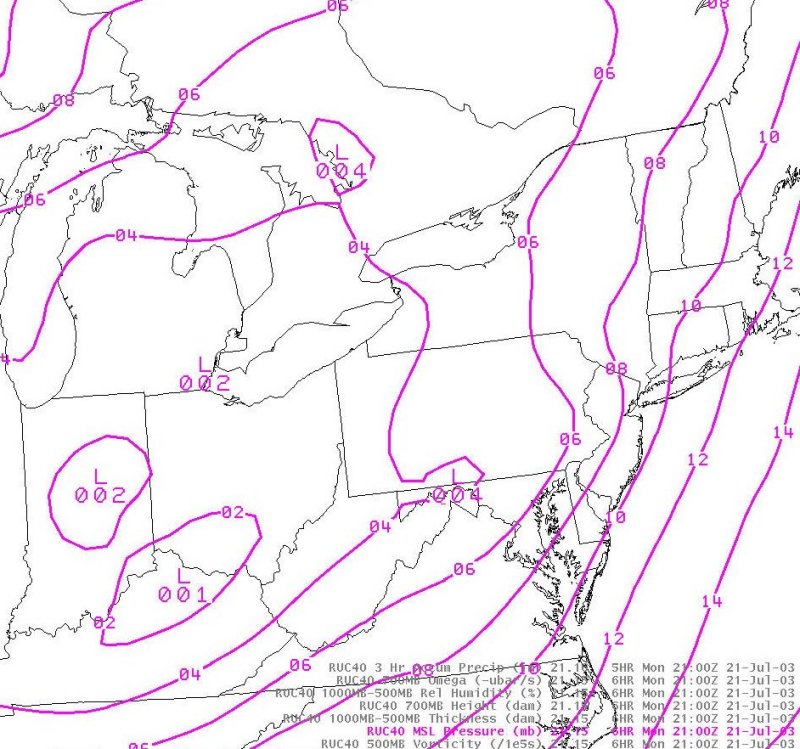
Figure 9b. 6-hour RUC forecast 925 mb theta-e convergence valid 21 UTC on the 21st.
Figure 10 shows a 5-hour RUC forecast of surface and 700 mb winds valid at
21 UTC on the 21st. The weaker surface low pressure farther to the
southwest on the RUC forecast resulted in a lighter, more southeasterly
forecast surface flow late in the day over northeast Pennsylvania and
central New York (as opposed to the Eta forecast southerly flow).
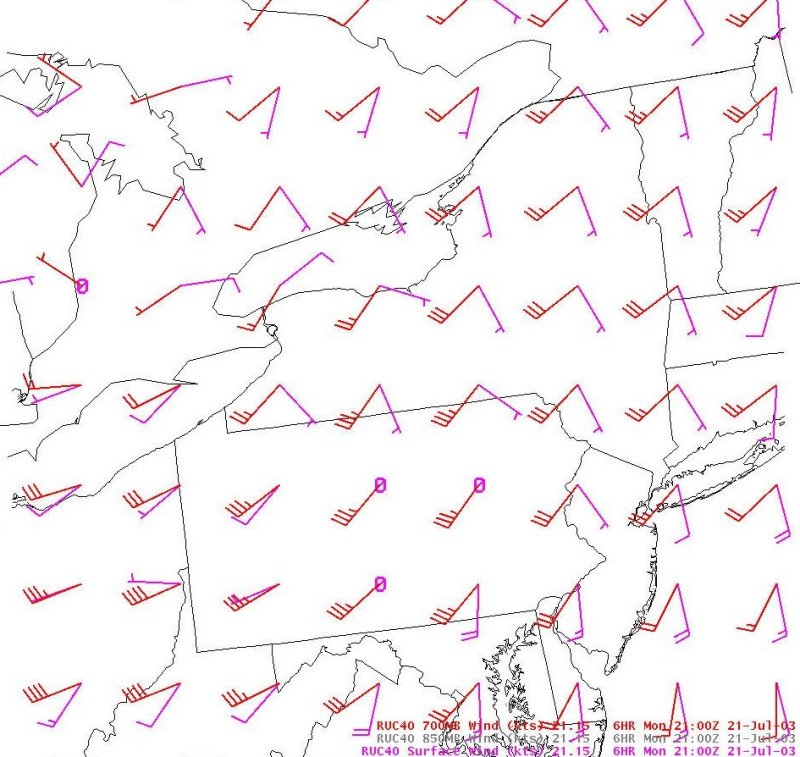
Figure 10. 5-hour RUC forecast 700 mb and surface winds valid 21 UTC on the 21st.
The result of a more backed low-level flow on the RUC forecast was more
shear forecast by the RUC, compared to the Eta. Figure 11 shows a RUC
forecast of surface-based CAPE and 0-6 km shear, valid at 21 UTC on the
21st. CAPE values were similar to what the Eta was forecasting (1000 to
1400 J/kg), however the shear was about 10 kts stronger (40 to 45 kts,
compared to 30 to 40 kts). 0-6 km shear values of 40 to 45 kts are well
above established thresholds for organized convection.
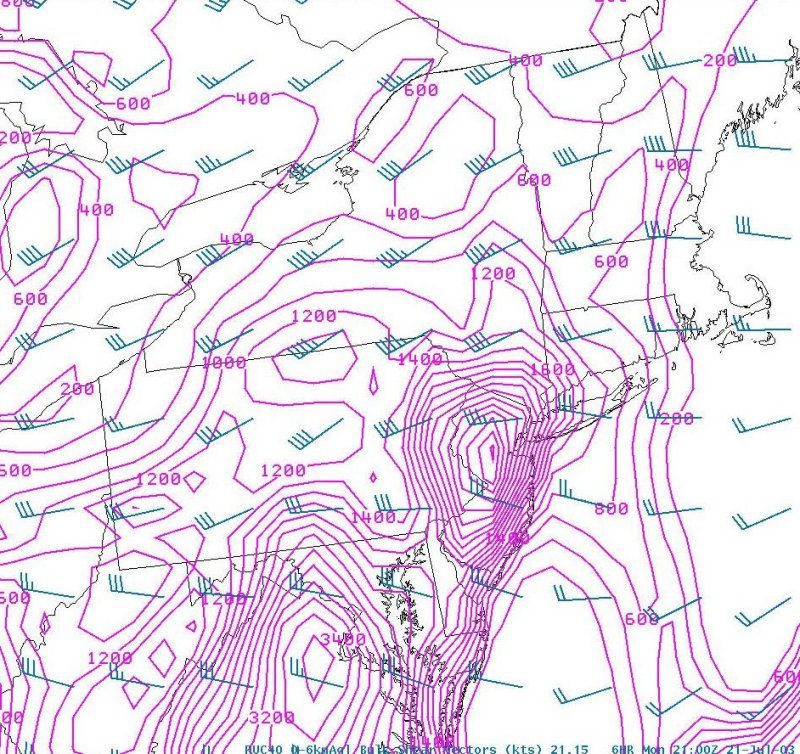
Figure 11. 5-hour RUC forecast 0-6 km shear and CAPE valid 21 UTC on the
21st.
The first thunderstorms of the day developed shortly before 18 UTC on the
21st. Figures 12a and b show 4 panel displays of reflectivity and storm
relative motion (SRM) respectively at 1747 UTC. This storm produced wind
damage in Great Bend (Susquehanna county), Pennsylvania.
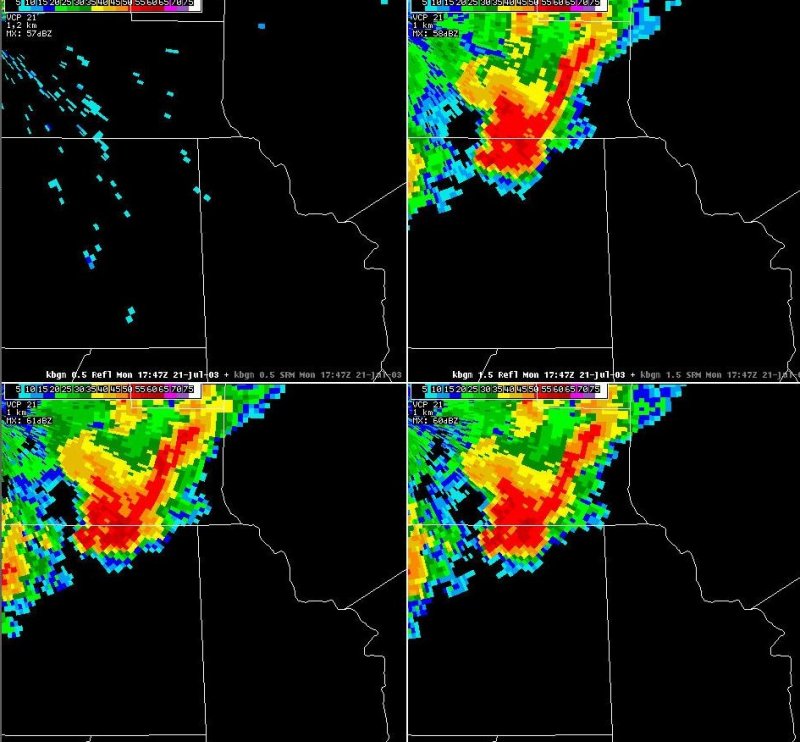
Figure 12a. 4 panel display of reflectivity from the KBGM WSR-88D at 1747 UTC
on the 21st.
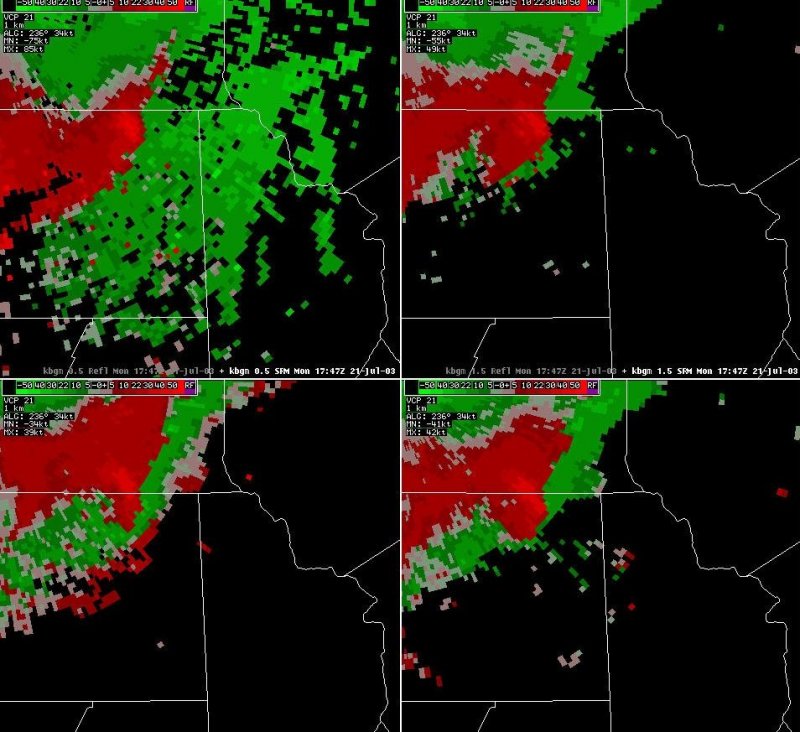
Figure 12b. 4 panel display of SRM from the KBGM WSR-88D at 1747 UTC.
One notable feature on these images is the area of strong outbound storm
relative velocities over northeast Susquehanna County, Pennsylvania, and
the resultant strong mid-altitude radial convergence (MARC) signature.
Damage occurred over northeast Susquehanna County about 15 minutes after
these images.
A second storm developed further north shortly after the Susquehanna
county storm, and moved east across Delaware County. This storm produced
a swath of wind damage across central Delaware County, including many large
trees blown down in a campground near Delhi. Fortunately, timely warnings
of this storm resulted in the many campers being moved to safety before the
storm struck. Figures 13a and b show 4-panel displays of reflectivity and
SRM associated with that storm.
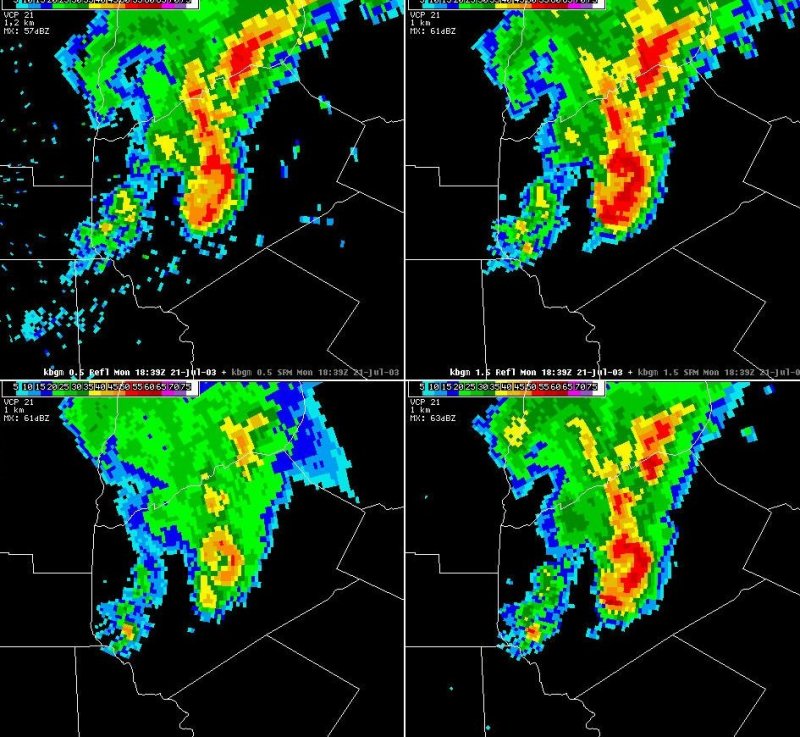
Figure 13a. A 4-panel display of reflectivity from the KBGM WSR-88D at
1839 UTC.
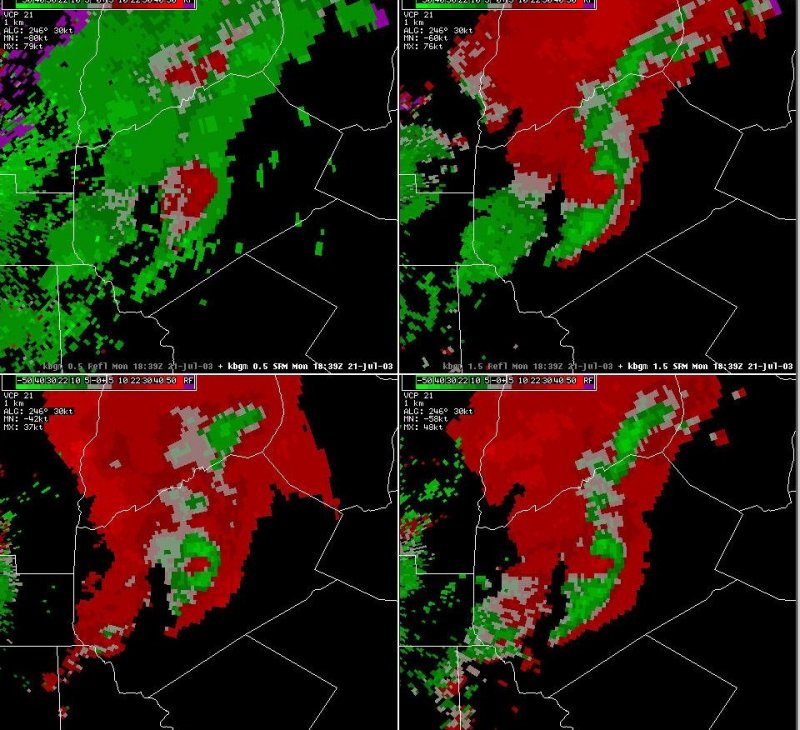
Figure 13b. A 4-panel display of SRM from the KBGM WSR-88D at 1839 UTC.
Most notable on these images is the very distinct bow echo signature,
especially evident on the reflectivity data, over central Delaware County.
Outflow from these storms likely helped to reinforce the larger-scale
boundary that was setting up across Pennsylvania. Low clouds north of the
boundary kept temperatures in the 70s across southern New York, while more
sunshine allowed temperatures to climb well into the 80s across
Pennsylvania (Figure 14).
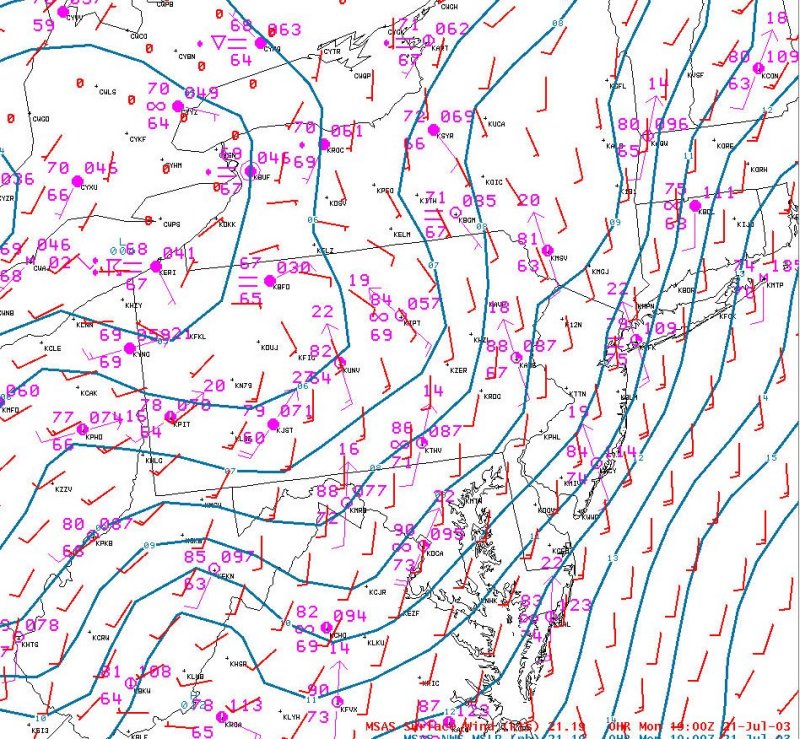
Figure 14. 1900 UTC surface plot, MSAS mean sea-level and wind barbs.
While the aforementioned temperature boundary was strengthening over
northern Pennsylvania, the vorticity maximum over northeast Pennsylvania
was moving east toward northern Pennsylvania. Figure 15 shows the IR
satellite imagery at 1900 UTC on the 21st.
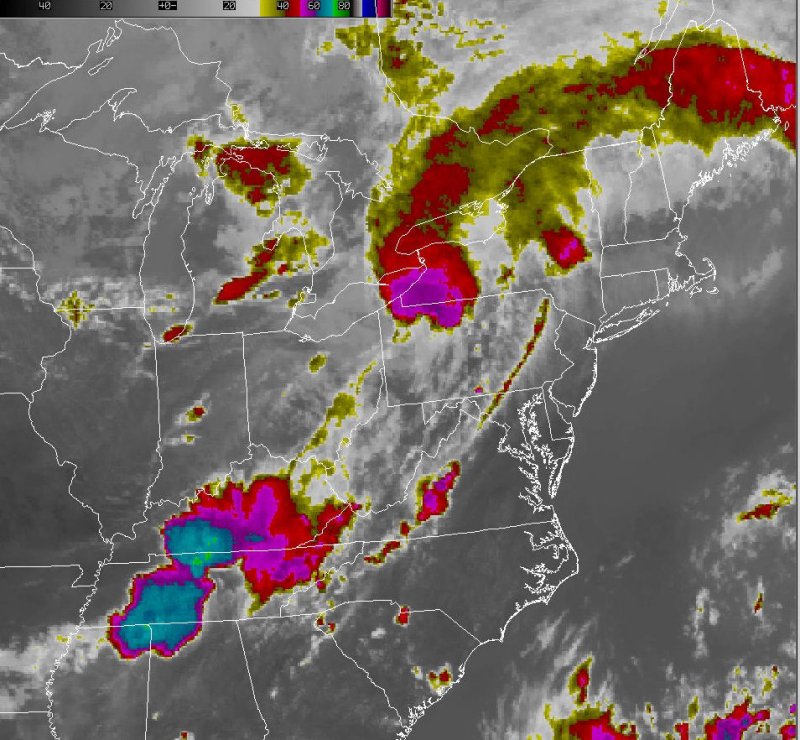
Figure 15. IR satellite image at 1900 UTC on the 21st.
Severe convection developed in association with that vorticity maximum
over northeast Ohio by mid afternoon on the 21st, then moved rapidly east.
By late afternoon, a long, organized line of severe thunderstorms was
moving rapidly east across northern Pennsylvania and west central New York.
The atmosphere ahead of the line had become moderately unstable, as
indicated by an analysis of 100 mb mean parcel CAPE taken from the SPC web
page at 2000 UTC (Figure 16).
Figure 16. 100 mb mean parcel CAPE and convective inhibition (CIN) from
the SPC analysis web page at 2000 UTC on the 21st.
The remaining figures in this study show radar imagery as the line of
storms was moving east across central New York and northeast Pennsylvania.
Figures 17a and b show 4-panel displays of reflectivity and SRM at 2017 UTC,
as the line was moving east through Stueben county.
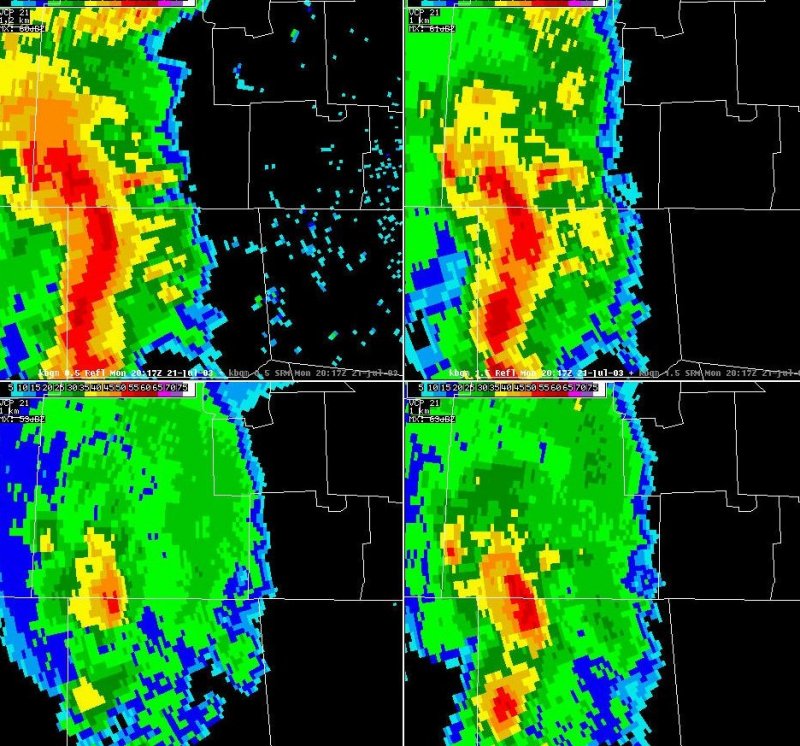
Figure 17a 4-panel display of reflectivity from the KBGM WSR-88D at
2017 UTC.
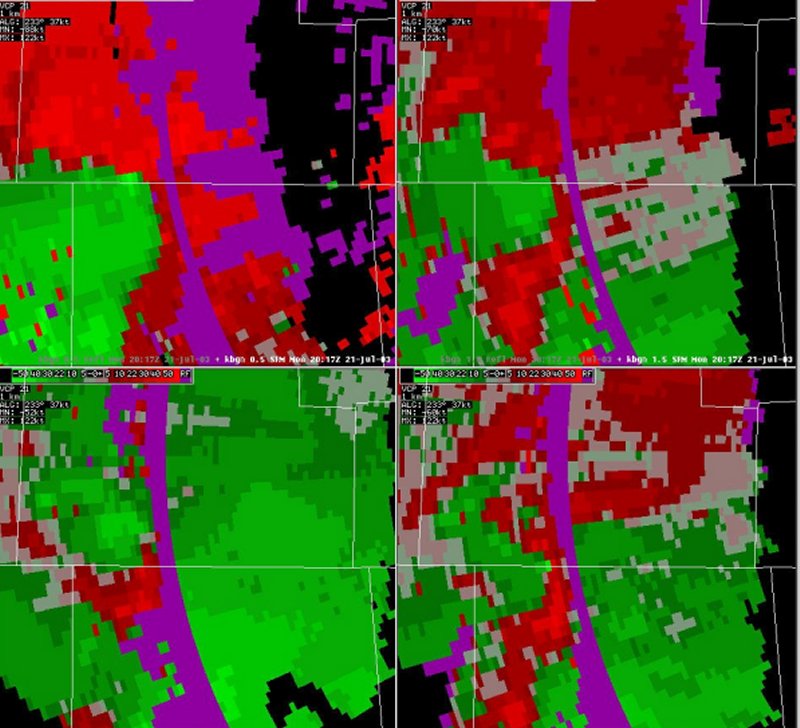
Figure 17b. 4-panel display of SRM from the KBGM WSR-88D at 2017 UTC.
A strong bow echo is indicated moving along the Pennsylvania / New York border. A book-end
vortex feature is indicated along the border, as a strong inbound / outbound couplet in the
SRM data. Enhanced wind damage occurred in the area of this couplet, however a tornado was
not confirmed. (Earlier, a similar looking feature produced an F3 tornado over Potter
County in northern Pennsylvania).
Figures 18a and b show 4-panel displays of reflectivity and SRM data at
2115 UTC, as the bow echo was moving east across west central New York.
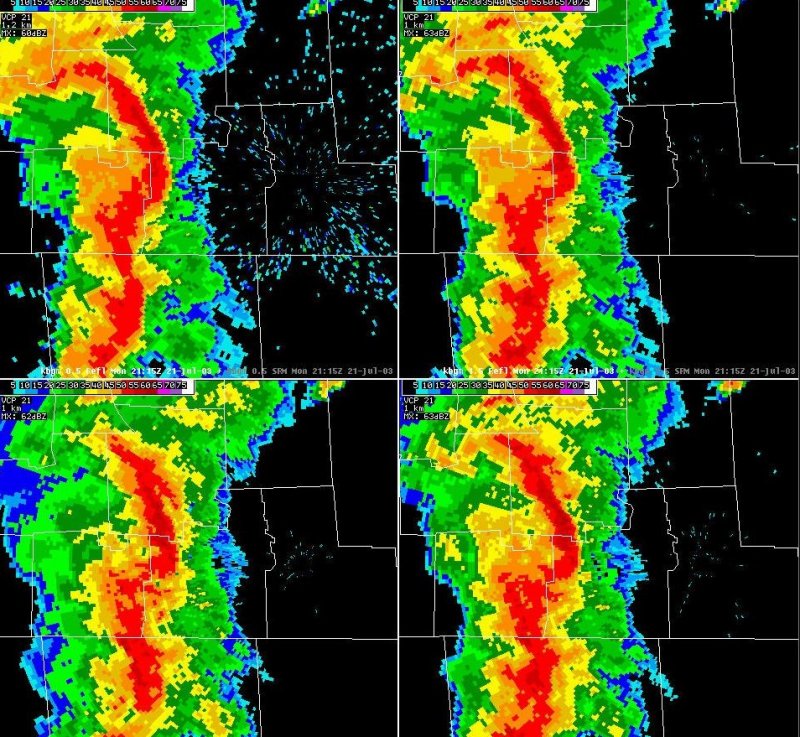
Figure 18a. A 4 panel-display of reflectivity from the KBGM WSR-88D at
2115 UTC.
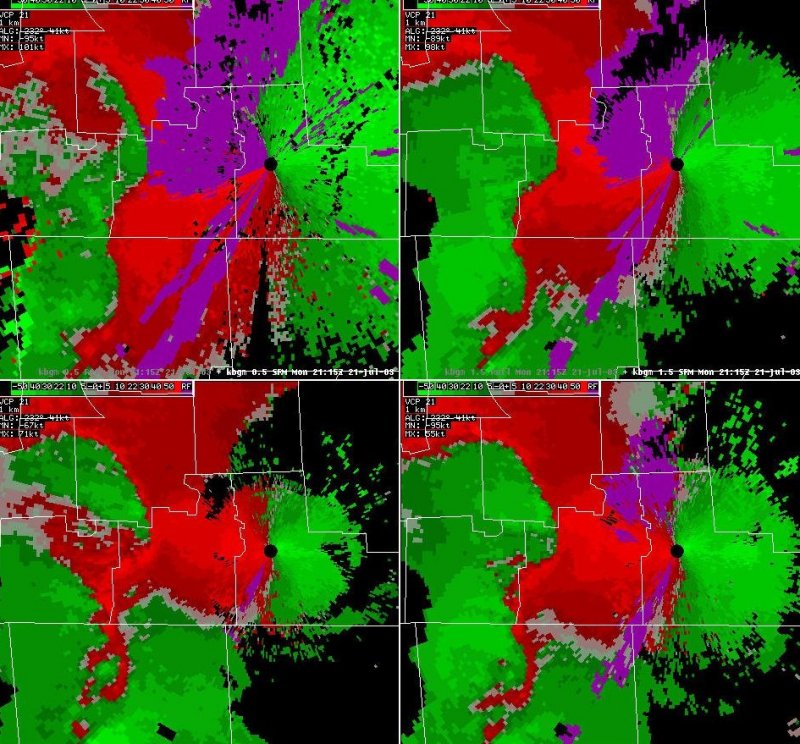
Figure 18b. A 4-panel display of SRM from the KBGM WSR-88D at 2115 UTC on the 21st.
Most notable features at this time was the distinct bow echo moving east
across northwest Tioga County and southwest Tompkins County, with strong
convergence at all levels at the leading edge of the bow (indicating the
interface between the backward sloping updraft and the frontward sloping
downdraft). Widespread wind damage occurred through-out the southern tier
of New York as the bow echo moved east across the area.
Figures 19a and b show 4-panel displays of reflectivity and SRM as the
bow echo moved east across the western Catskill mountains.

Figure 19a. A 4-panel display of base reflectivity from the KBGM WSR-88D at
2323 UTC on the 21st.
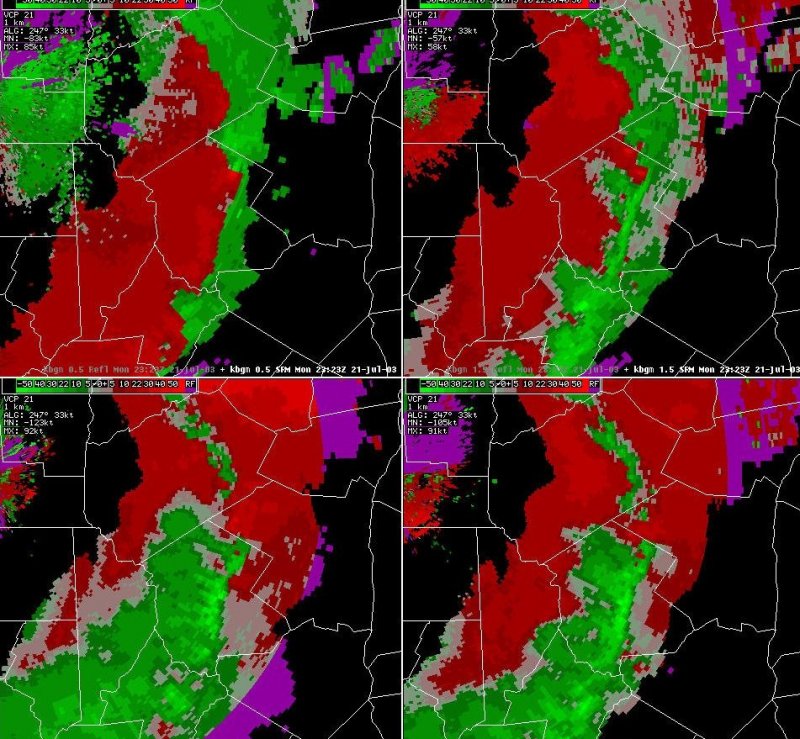
Figure 19b. A 4-panel of SRM from the KBGM WSR-88D at 2323 UTC on the 21st.
Most notable on this series of images is the rotational couple over
northeast Sullivan County. The couplet appears to be associated with a
weak "broken S" signature on the reflectivity data. An F1 tornado, the
only confirmed tornado with the event, was confirmed over northeast
Sullivan county.
In summary, a major severe weather outbreak occurred over central New York
and northeast Pennsylvania during the afternoon of July 21st, 2003. The
outbreak occurred in the right rear quadrant of an upper-level jet over
eastern Canada, and downstream from a strong upper-tropospheric trough over
the Great Lakes. Large-scale forcing for upward motion was enhanced when a
mid-tropospheric vorticity maximum moved east across the area, in an
environment characterized by strong low-level warm advection and equivalent
potential temperature convergence.
Model forecast shear profiles indicated that the deep layer shear was sufficient
for organized convection, with most of the shear confined to the lowest 2 km,
indicating an environment favorable for outflow dominated, forward propagating
convection (a squall line). Model forecasts of dry air at mid-levels, advecting
into the area from the west, indicated the potential for cold pool enhancement with
any convection that would develop, and therefore enhanced surface winds. Comparisons
between the 12 UTC Eta and later runs of the RUC, indicated that the later runs of the
RUC provided stronger signals for severe convection, including forecasting a stronger
vorticity maximum and more shear.
The convection that developed in this environment was isolated at first,
but later became organized into a long-lived squall line. Damage with the
line was mainly associated with straight-line winds, however an F1 tornado
was confirmed over the western Catskills, and an F3 tornado was confirmed
over northern Pennsylvania.