| Created with the Web Accessibility Wizard |
Long Description: surface plot 1/30 00z
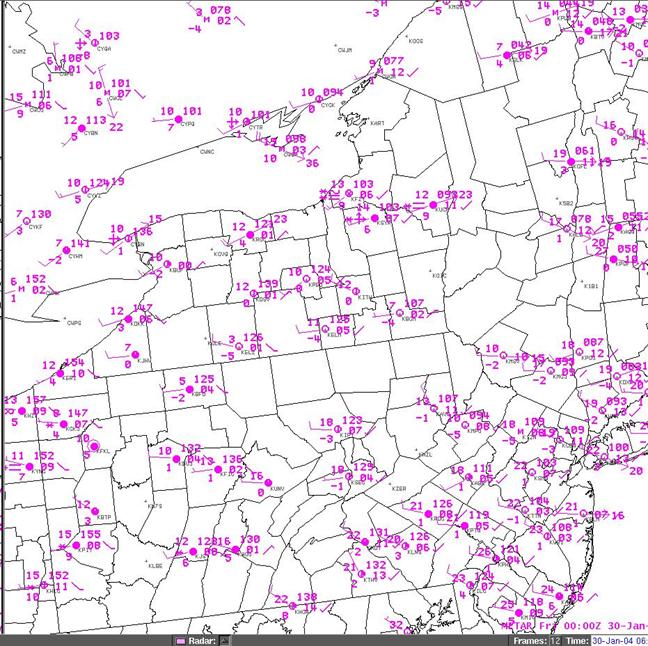
Surface plot at 00z on the 30th.
Slide Links:
Speaker Notes:
This plot shows the cold air over southern and central NY south of Lake Ontario at 00z on the 30th. This is another indication that the air in that area would be relatively stable.
| Graphic Version |