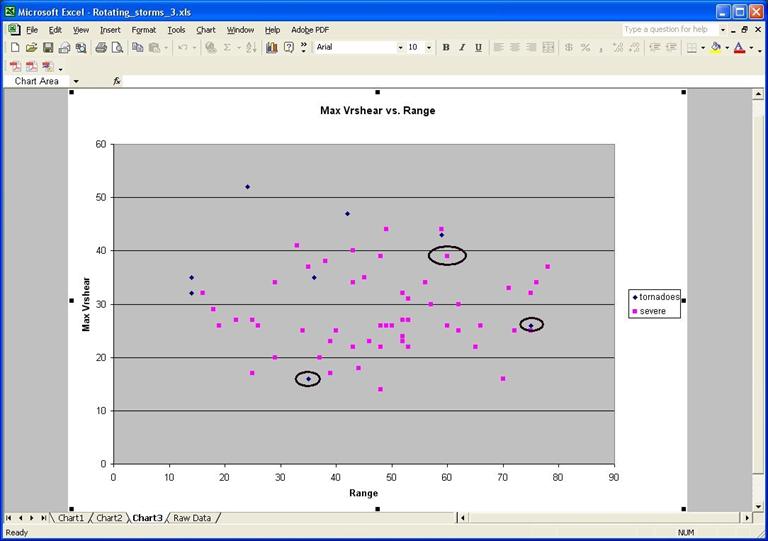
Max Vrshear vs. Range (rotating storms from 2003 – 2005)
| Created with the Web Accessibility Wizard |
|
Max Vrshear vs. Range (rotating storms from 2003 – 2005) |
|
|
Slide Links:
Speaker Notes:
The difficulty of the tornado vs. severe warning decisions on this day are indicated by the data on this graph. The maximum Vr shear and range values associated with the two tornadoes on this day are indicated by the circled blue diamond shaped points. Meanwhile, the maximum Vr shear and range value associated with the straight-line winds over Sullivan County are indicated by the circled purple square. Note that the maximum Vr shear value associated with the straight-line winds was much higher than the maximum value associated with the two tornadoes.