| Created with the Web Accessibility Wizard |
| How impressive was the rotation with our tornadoes? |
|
|
Slide Links:
Speaker Notes:
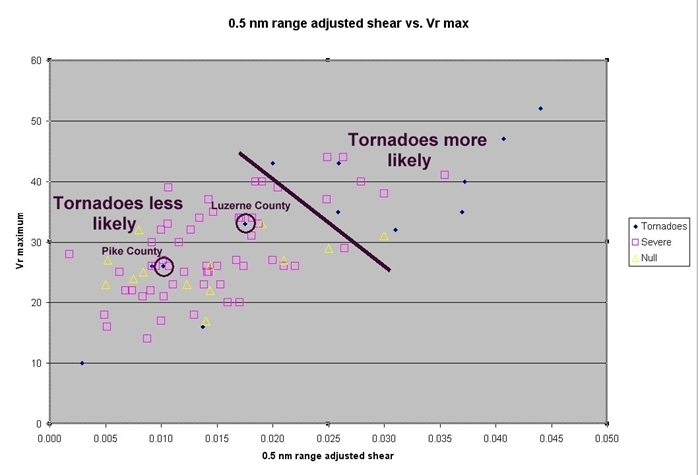
This diagram shows a scatter plot of KBGM WSR-88D measured shear vs. maximum rotational velocity for a selection of rotating storm cells that have occurred in northeast Pennsylvania and central New York during the period from 2003-2006. Tornadic events are plotted as blue diamonds, and non-tornadic severe events are plotted as purple squares. Shear was measured across a distance of 0.5 nautical miles for storms inside 30 nm of the radar, and from mid-point of the beam to mid-point of the adjacent beam for storms outside of 30 nm. Maximum rotational velocity was measured across the entire diameter of the meso-cyclone. The shear and maximum rotational velocity associated with the Luzerne and Pike county tornadoes are circled. Note that the rotation associated with our two December 1st tornadic cells was lower than what we often see with tornadoes in our area.