| Created with the Web Accessibility Wizard |
| Rotational velocity and the near-storm environment |
|
|
Slide Links:
Speaker Notes:
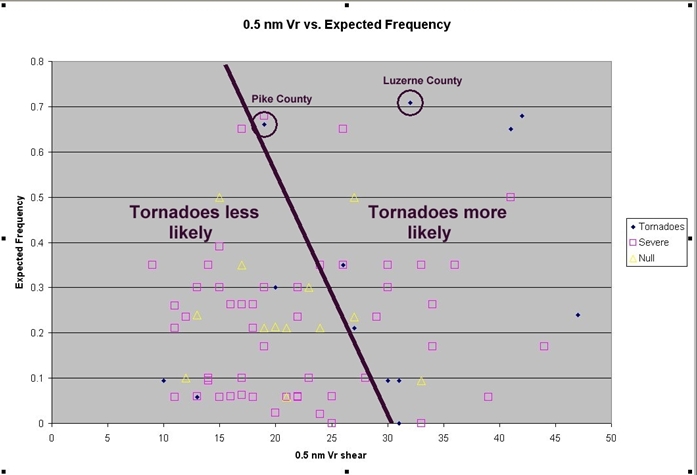
This slide shows a scatter plot of KBGM WSR-88D measured shear and expected frequency of tornadoes from the Togstad diagram, for a collection of rotating storms in northeast Pennsylvania and central New York from 2003-2006. Note that the cell that produced the Luzerne county tornado now clearly falls within an area where tornadoes can be expected, while the cell that produced the Pike county tornado is near the boundary between "tornadoes more likely" and "tornadoes less likely".