First page Back Continue
Last page
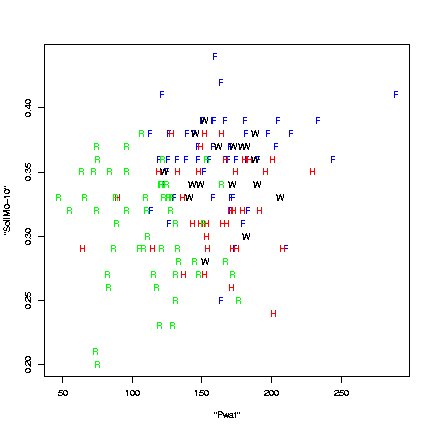
Pre-existing soil moisture effect on flash flooding
Notes:
This chart shows results from research from a cooperative project between Cornell University and the National Weather Service. Flash flood events are plotted with an F. Heavy rain events that did not produce flash flooding are plotted with an H. The y axis represents 0-10 cm soil moisture as a fraction, and the x axis represents precipitable water (a measure of atmospheric moisture) as a percent of normal. A key threshold for flooding events vs. heavy rain events that do not produce flooding appears to be 0-10 cm soil moisture values of greater than 0.35 prior to the onset of the heavy rain. Note that the majority of events that produced heavy rain, also produced flooding when the soil moisture was greater than 0.35. Note also that both heavy rain events and flash flood events appear to occur almost exclusively when the precipitable water is greater than normal (greater than 100 percent).