Multisensor Precipitation Estimated (MPE) storm total precipitation
| Created with the Web Accessibility Wizard |
|
Multisensor Precipitation Estimated (MPE) storm total precipitation |
|
|
Slide Links:
Speaker Notes:
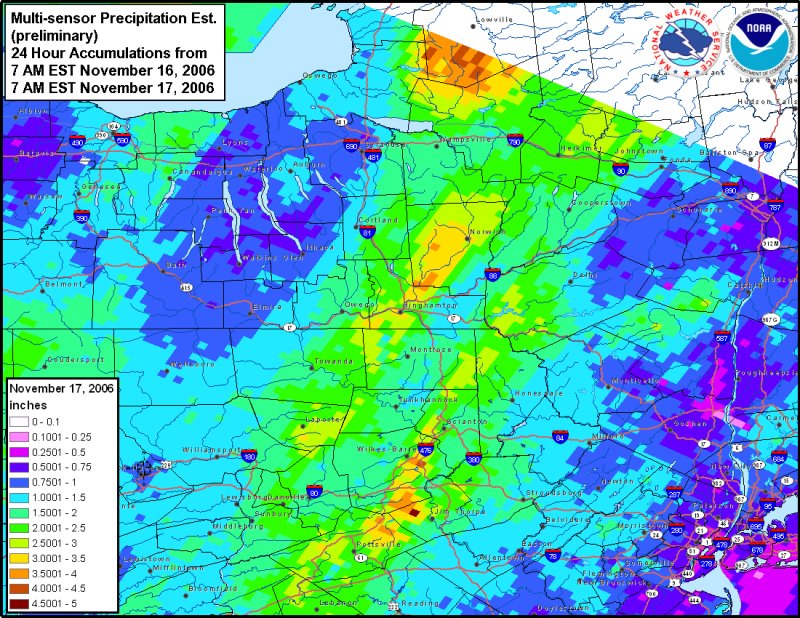
The graphic above is a Multisensor Precipitation Estimates map, otherwise known as MPE data. The data used to produce this graphic is a combination of radar and precipitation gages. Two stripes of 2 to 4 inch rainfall totals can be seen from the Wilkes-Barre/Scranton area extending northeast, and the Binghamton area through Chenango county. Most of this rain fell in a very short time period, with spotter reports indicating over an inch of rain falling in less than half an hour in some locations.