Primary surface low central pressure valid December 16, 12z
Notes:
This chart shows the sea-level pressure trend from the NAM, GFS, ECMWF, GFS Ensemble, and SREF, of the primary low over the Ohio Valley, valid at December 16, 12z. Forecast lead time decreases from left to right. The observed low pressure value (991 mb) is plotted with a black X. The NAM and ensemble forecasts appeared to trend increasingly more intense with the primary low, while the GFS and ECMWF were more consistent.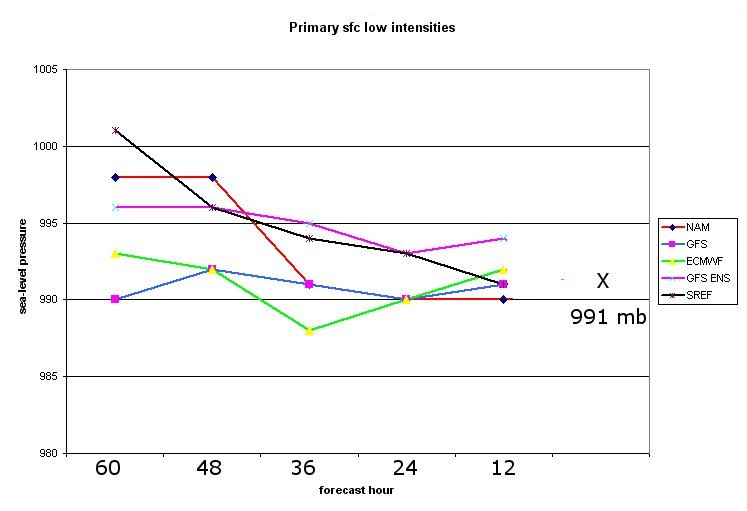
Slide 11