Forcing – upper level PV and mid-level frontogenesis – 12/11 18z
Notes:
The next 3 slides show NAM 6, 12 and 24 hour forecasts of tropopause pressure (contoured yellow), and 700-500 mb frontogenesis (shaded), valid at 18z on the 11th, 00z on the 12th and 12z on the 12th. Upper level waves are indicated by axes of high pressure at the tropopause (annotated by white lines). A series of waves was forecast to move north along the east coast during the afternoon and evening of the 11th, while a southwest-northeast axis of frontogenesis remained nearly stationary from Alabama to Maine. The main wave was moving northeast up the mid-Atlantic coast by 12z on the 12th.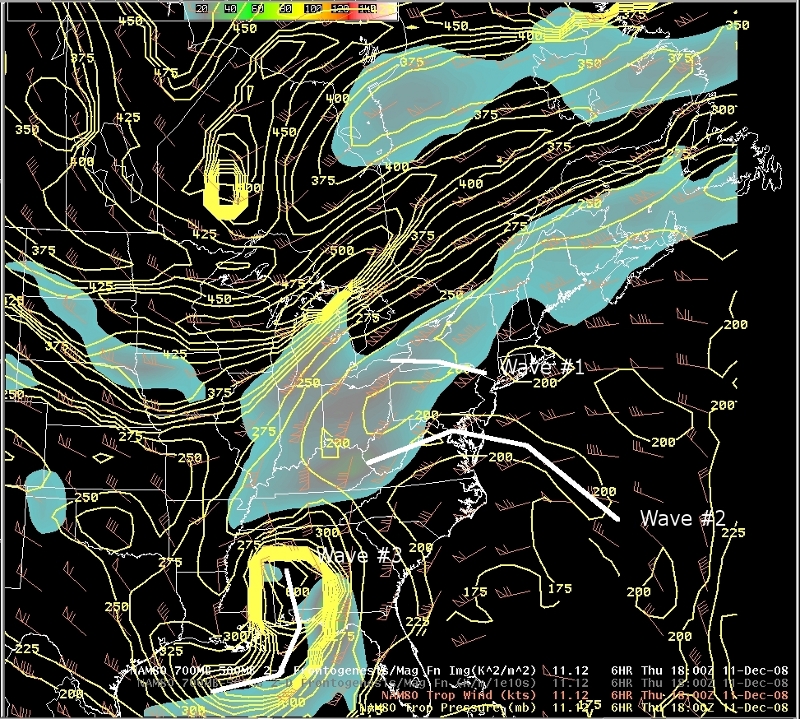
Slide 14