Pressure and wind at the tropopause / 850-700 mb frontogenesis
Notes:
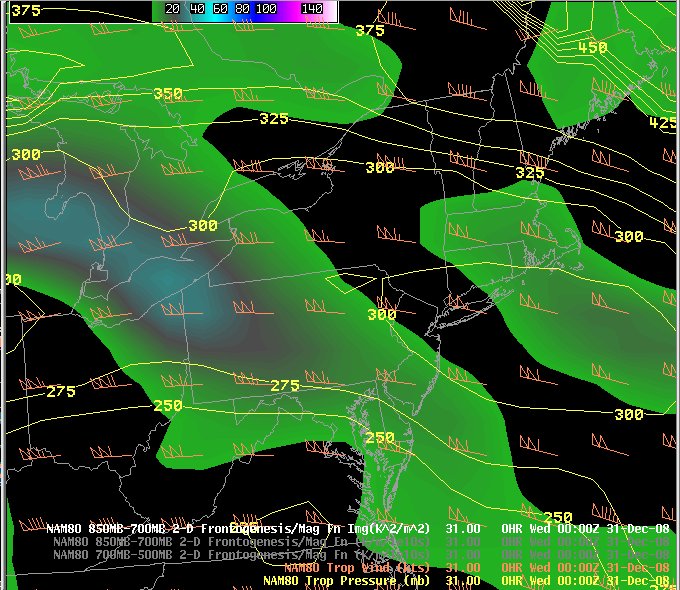
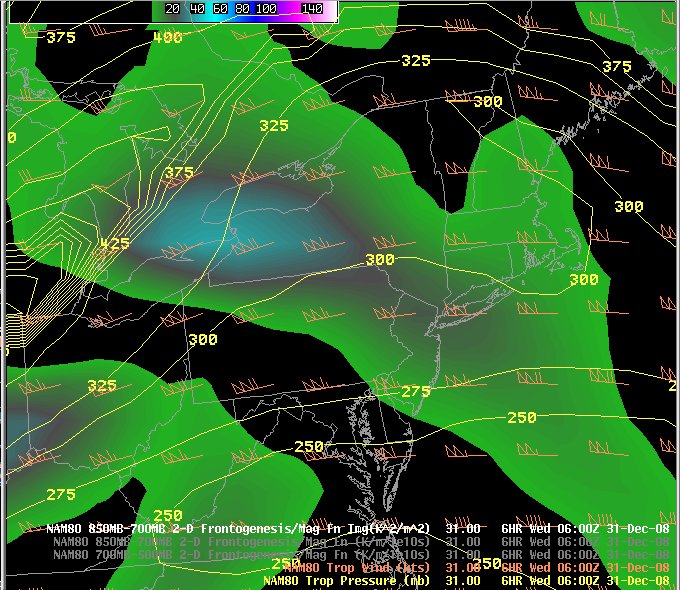
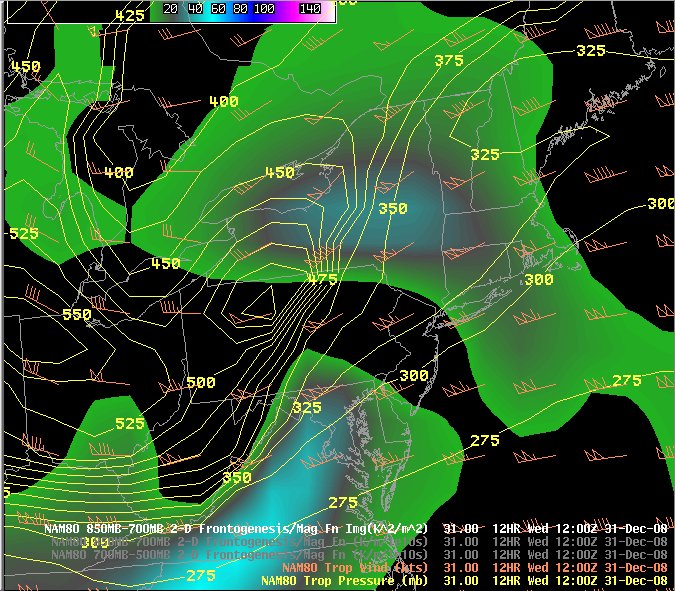
The plots on this slide show forecasts of pressure and wind at the tropopause, along with 850-700 mb frontogenesis (positive values shaded). Forcing for upward motion associated with the mid to upper level wave is indicated in areas where the wind is blowing from high to low pressure. The upper wave itself is indicated by high pressure at the tropopause. Through 06z, forcing for upward motion over central NY was mainly associated with low to mid level frontogenesis and isentropic lift (shown on the next slide). By 12z, the upper level wave was moving east toward the mid-Atlantic area, with the associated forcing also increasing across the area as the frontogenesis began to lift off to the northeast.|
Switch images by moving your mouse pointer over the links below...
Valid Thu 1800 UTC 11-Dec-2008 Valid Fri 0000 UTC 12-Dec-2008 Valid Fri 0600 UTC 12-Dec-2008 |
|
Slide 5