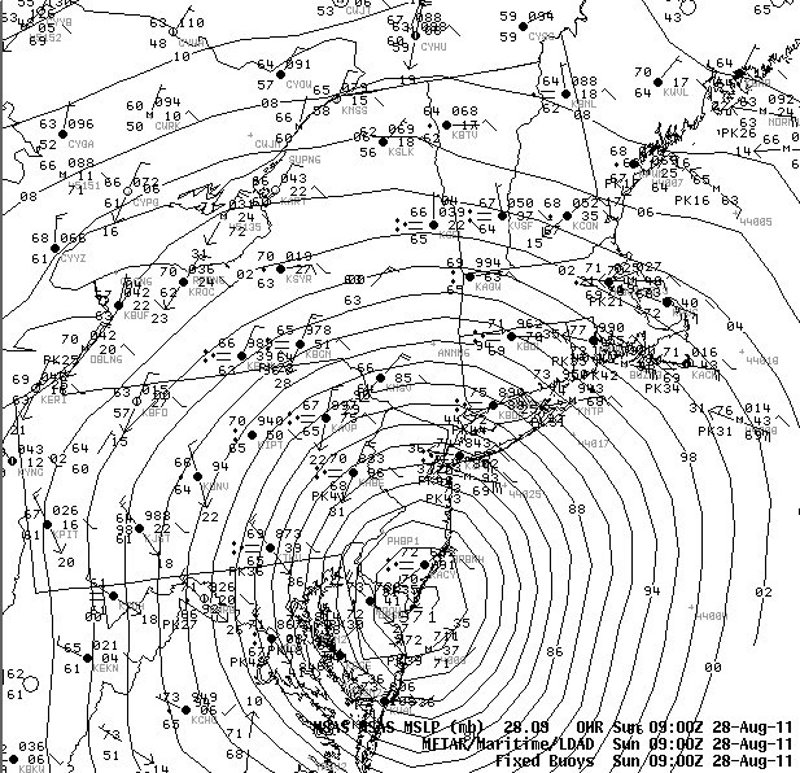
Surface Plots 0900z to 1500z
Notes:
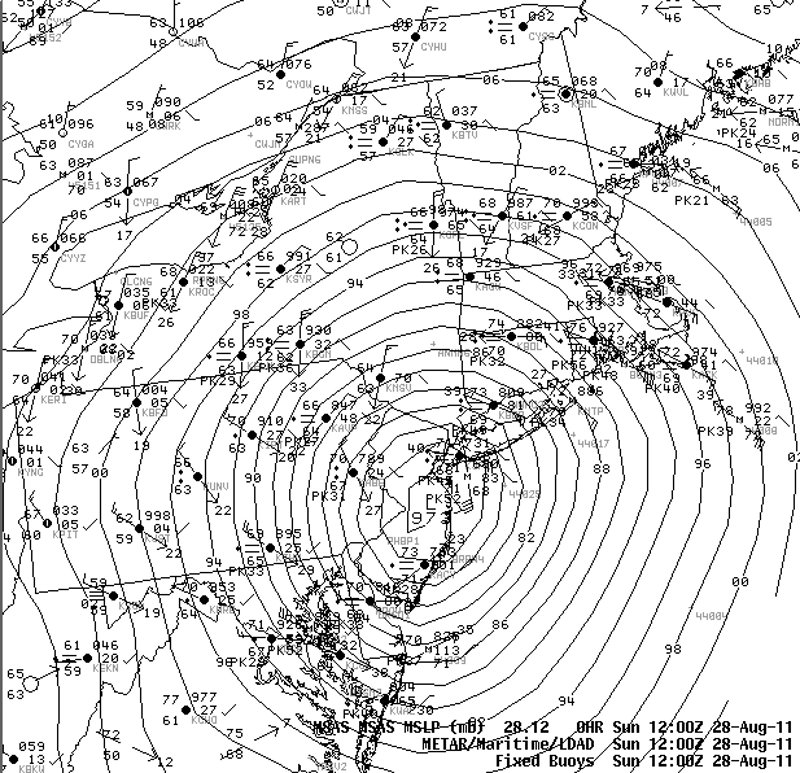
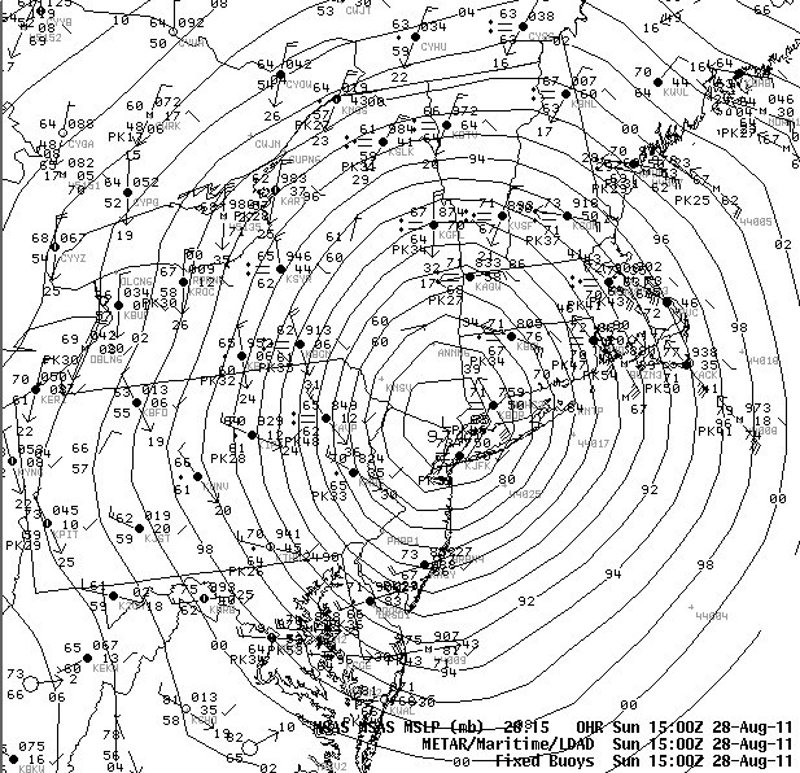
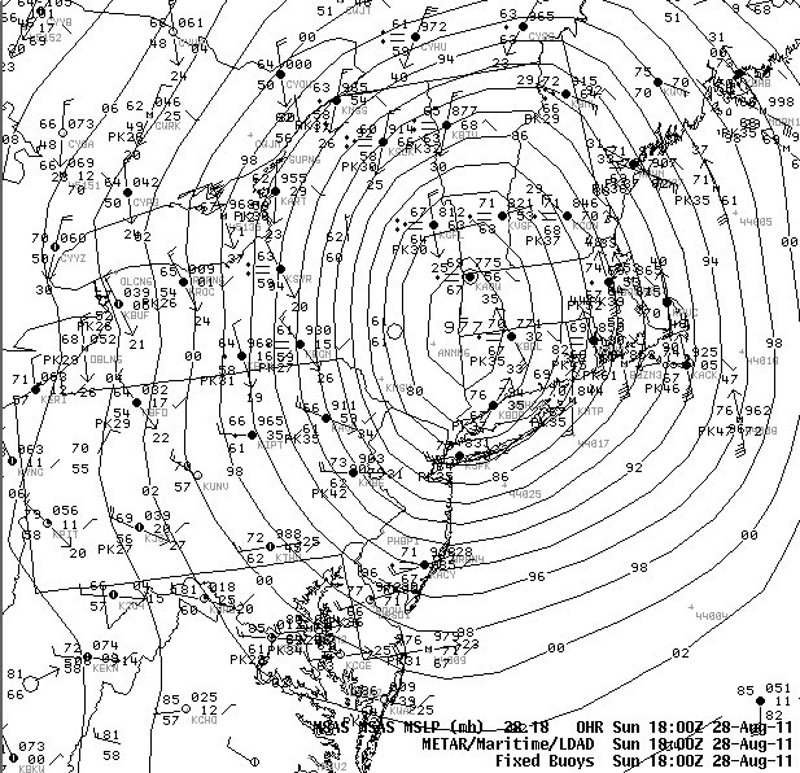
These slides show surface plots at 09z through 18z on the 28th, as tropical storm Irene was moving north along the east coast. Moist, tropical air, with dew points in the lower 70s can be seen along and east of the track, however cool air was located west of the track, with temperatures and dew points in the lower to mid 60s over central Pennsylvania and New York. These plots indicate that Irene was beginning to interact with a baroclinic zone on the 28th, was beginning a transition to extra-tropical.
|
Switch images by moving your mouse pointer over the links below...
Valid Sun 0900 UTC 28-Aug-2011 Valid Sun 1200 UTC 28-Aug-2011 Valid Sun 1500 UTC 28-Aug-2011 Valid Sun 1800 UTC 28-Aug-2011 |
|
Slide 12