500 mb height anomaly
Notes:
The trough over the Ohio Valley featured heights that were 1 to 2 standard deviations below normal. The ridge along the east coast was associated with heights that were 1 to 2 standard deviations above normal over New England. Note: all anomaly plots in this presentation are courtesy of the NWS forecast office in State College, Pa.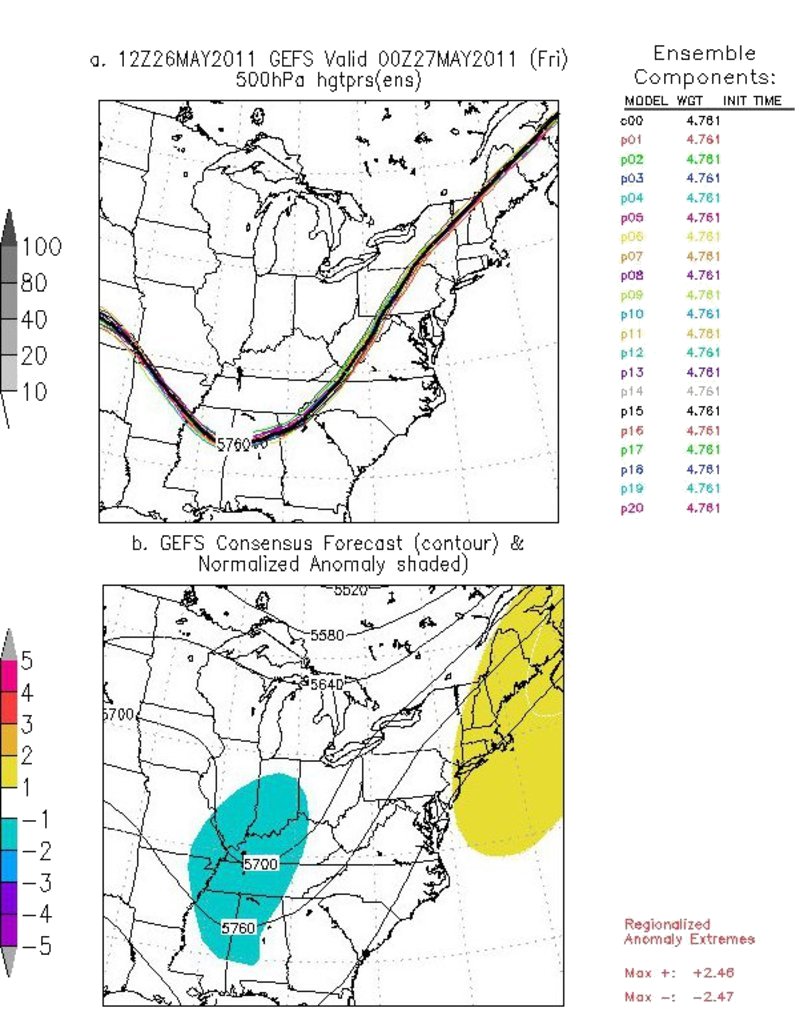
Slide 3