850 mb wind, pwat, CAPE and PMSL anomalies
Notes:
This 4 panel display shows the probability that the standardized anomaly associated with several key fields exceeds two standard deviations above normal, based on forecasts from the NCEP short range ensemble forecast system (SREF). The data on this slide indicates that the southerly flow was anomalously strong over the mid-Atlantic region on the 26th, and the surface-based CAPE was anomalously large over the northern mid-Atlantic region. Anomalously large precipitable water values were forecast along the frontal boundary across western and northern New York.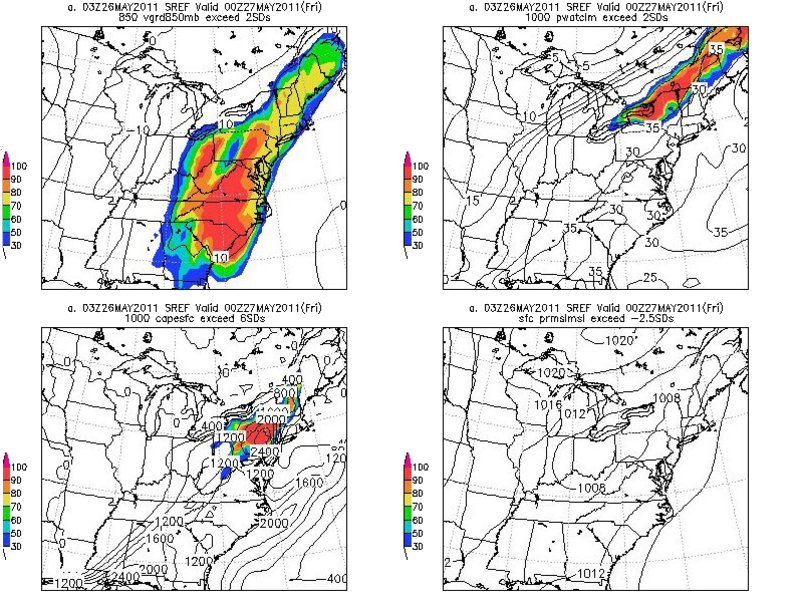
Slide 5