500 mb height and sea-level pressure anomalies
Notes:
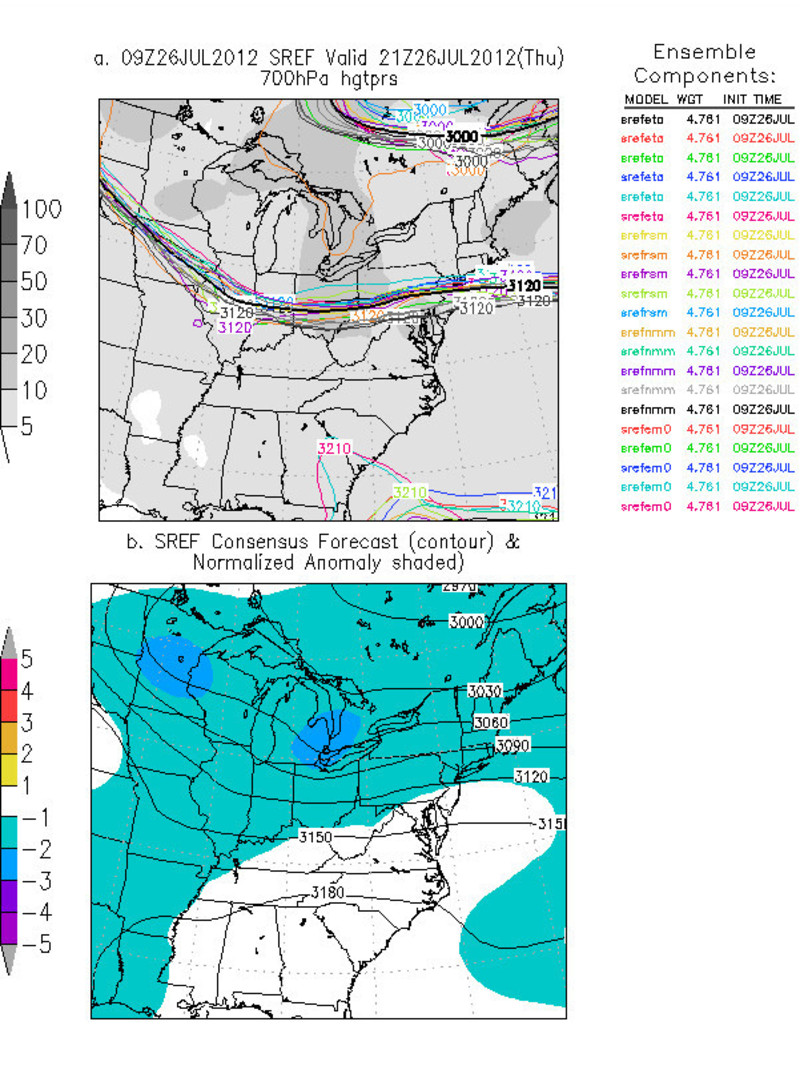
These anomaly plots indicate that the 500 mb trough was not very anomalously strong, with height departures of 2 to 3 standard deviations from normal. The surface low was slightly more anomalous, featuring departure values of 3 to 4 standard deviations from normal.Click on image to toggle between images.
Slide 8