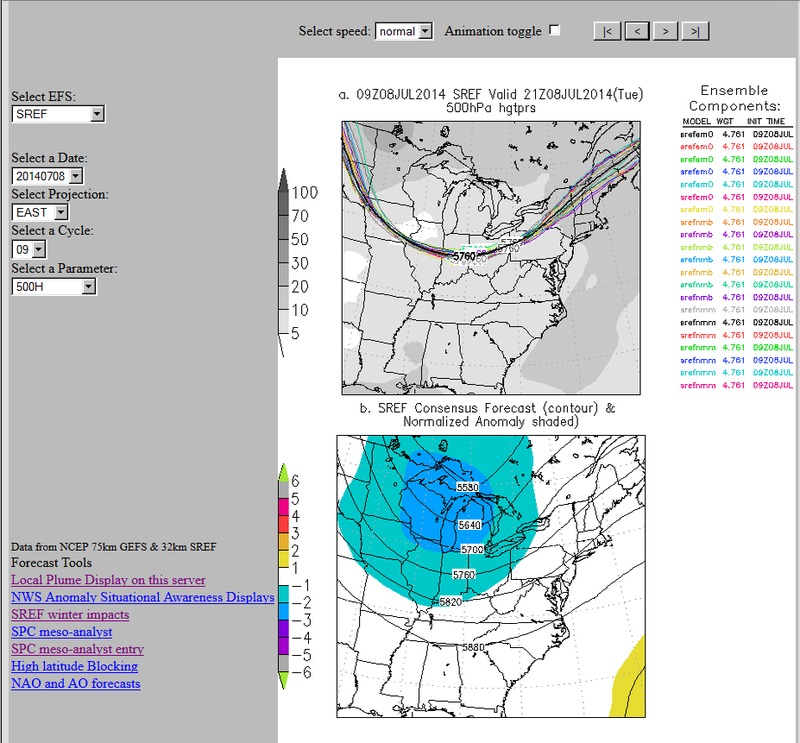
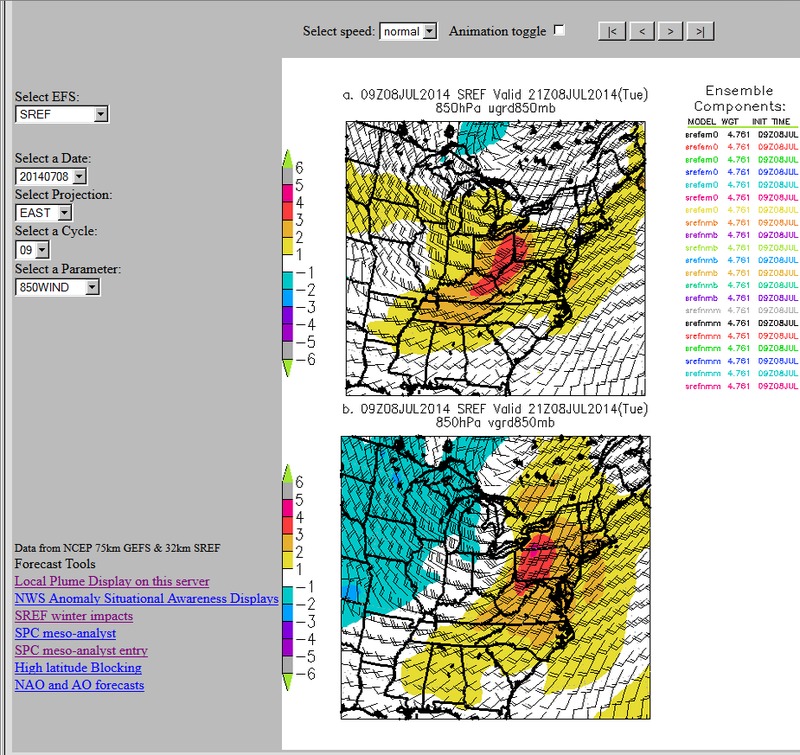
500 mb height and 850 mb wind anomalies
Notes:
These standardized anomaly plots (courtesy of the WFO in State College, Pa) show that the trough was somewhat anomalous, featuring 500 mb heights that were 2 to 3 standard deviations below normal. The lower-level flow was even more anomalous, with 850 mb u and v component winds that were 3 to 4 standard deviations above normal.
Switch images by moving your mouse pointer over numbered buttons...
|
|
|
Slide 5