Correlation coefficient and precipitation type
Notes:
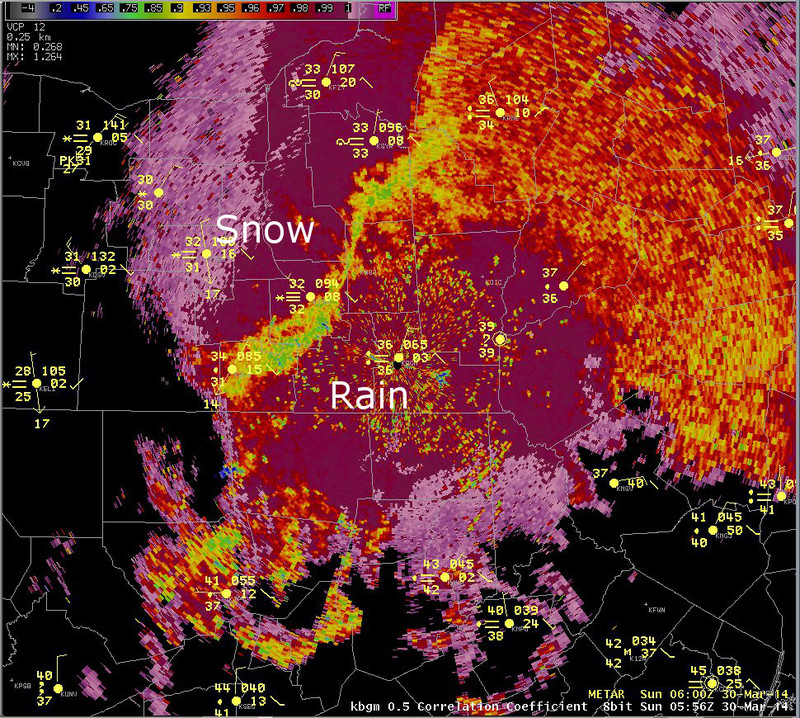
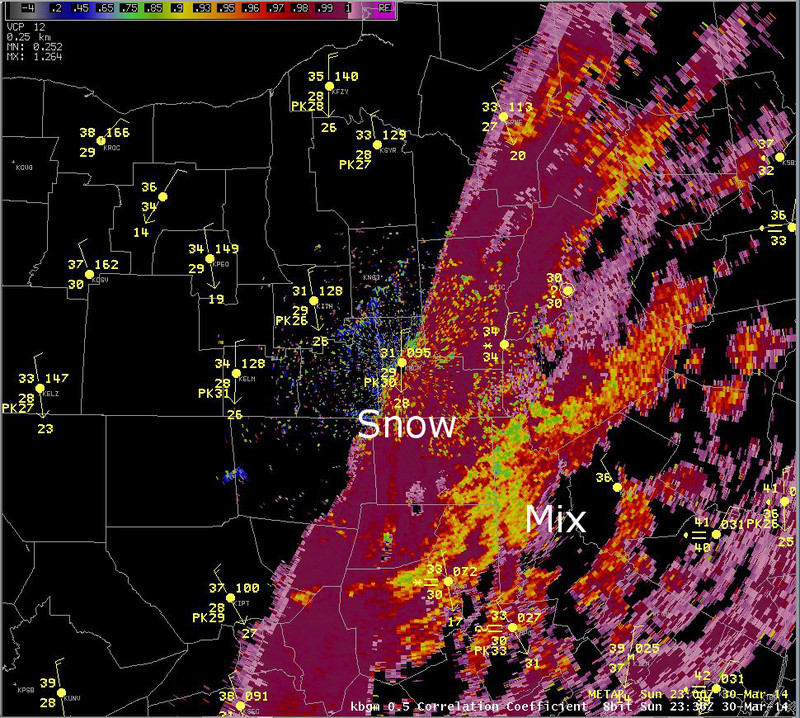
Dual polarization radar data was very helpful for identifying rain vs. snow vs. mixed precipitation boundaries through the event. The rain / snow boundary at 06z on March 30th can be clearly seen on the image on the left, indicated by the lower values of correlation coefficient. A boundary between snow and mixed precipitation can be seen at 00z on March 31st on the slide on the right, again indicated by lower values of correlation coefficient.
Switch images by moving your mouse pointer over numbered buttons...
|
|
|
Slide 19