Radar and surface plots
Notes:
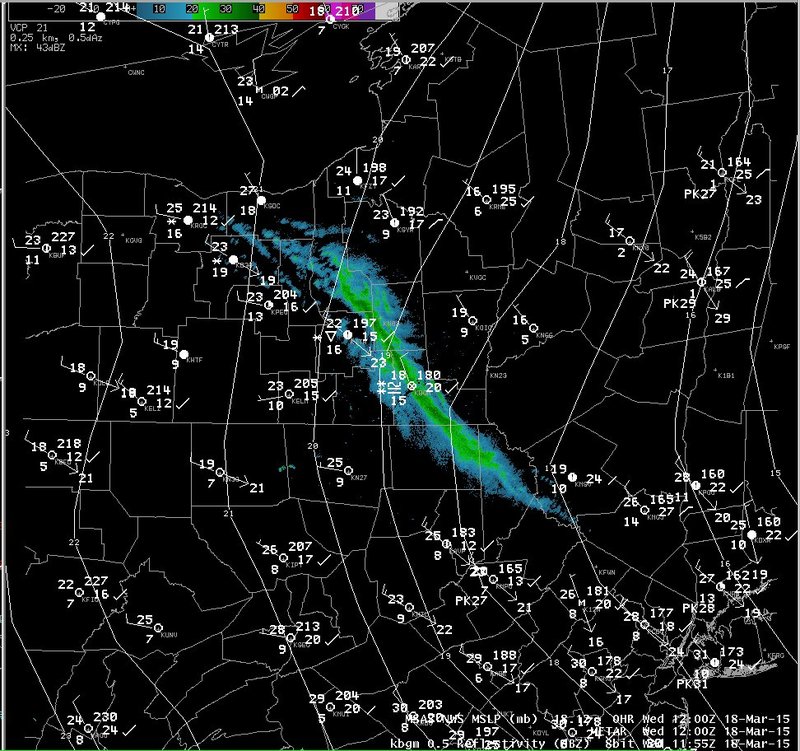
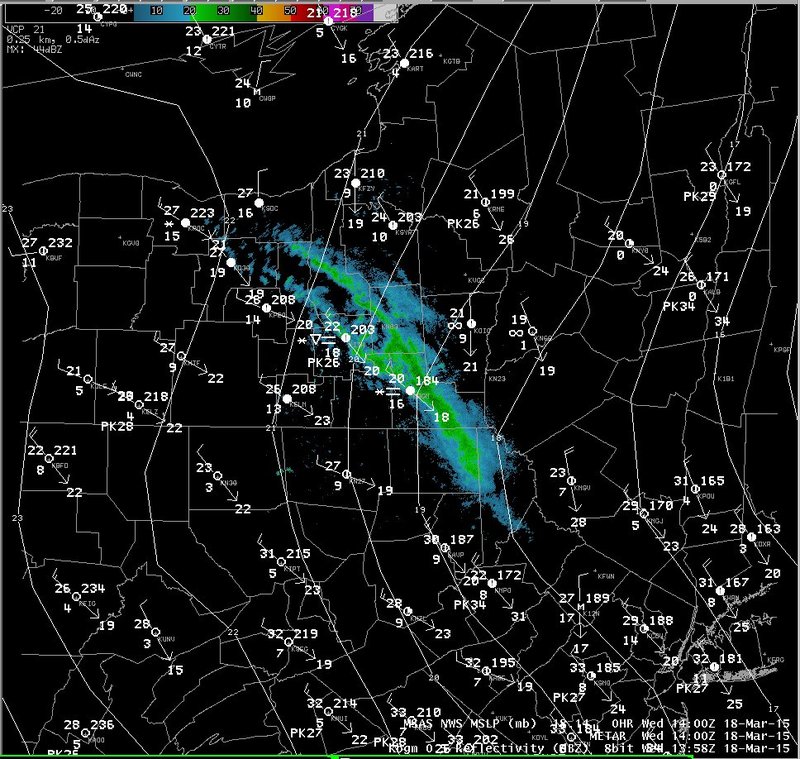
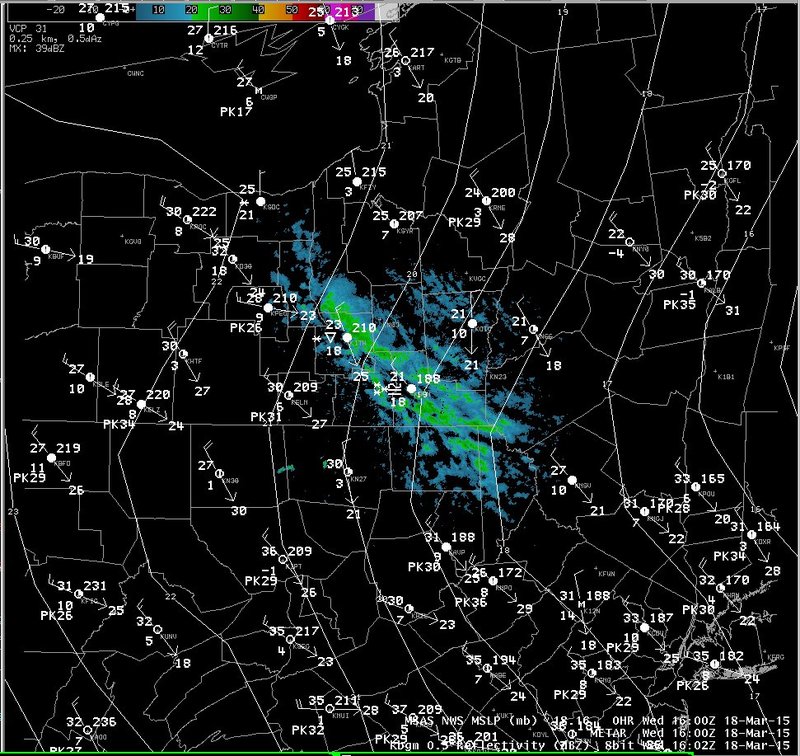
The surface and radar data shown on this slide shows the intense band at 12z on the 18th persisting until early afternoon before it begins to break up and become more cellular. Some surface wind convergence can also be seen on these plots along the axis of the band.
Switch images by moving your mouse pointer over numbered buttons...
|
|
|
Slide 15