A Preliminary Climatological Analysis Of River Flooding Along Major Central New York River Basins
Matthew C. NoyesCornell University Atmospheric Sciences
Ithaca, NY
and
Jeff S. Waldstreicher
National Weather Service
Binghamton, NY
ABSTRACT
A statistical analysis was conducted for Central New York river basins to determine the distribution and magnitude of river flooding on the basis of both season and location. Results produced in this analysis are the first step toward operationally applicable findings involving pattern recognition and its relation to flooding in this region. Through normalized scores, this study identifies and ranks the months and locations containing the greatest threat for flooding magnitude and coverage.
1. INTRODUCTION
Central New York is home to a number of large river basins, many of which are very prone to flooding. While river forecast models and other forecast techniques provide the basis for river forecasts and warnings of river flooding, a detailed climatology of central New York river flooding is another valuable tool that can assist in highlighting periods and locations of increased flood threat. This study, via a comprehensive statistical analysis, aims to identify the months and locations of most frequent flooding along Central New York's river basins. These results will help direct future studies of flooding in the region, including the development of a synoptic climatology of flooding that will encompass the role of antecedent conditions as well as atmospheric synoptic scale patterns associated with river flood events.
This paper presents the results of a statistical analysis of river crest data from 23 gauge locations along Central New York river basins dating back to the beginning of the 20th century. Basins and gauge locations used in this study are: the Cohocton River (Campbell); the Canisteo River (West Cameron); the Tioga River (Lindley); the Chemung River (Corning, Elmira, and Chemung); the Tioughnioga River (Cortland); the Otselic River (Cincinnatus); the Chenango River (Sherburne, Greene, and Chenango Forks); the Unadilla River (Rockdale); the Susquehanna River (Unadilla, Bainbridge, Conklin, Binghamton, Vestal, and Waverly/Sayre); the Delaware River East Branch (Hale Eddy); the Delaware River West Branch (Fishs Eddy); the Beaver Kill (Cooks Falls); and the main stem Delaware River (Callicoon/Damascus, and Barryville). Note, flood control efforts have been undertaken on most of these rivers at various times during the 20th century. These endeavors have likely altered the frequency and magnitude of flooding at a number of the gauge locations used in this study. It was not possible to specifically account for these flood control efforts in this study.
2. DATA ANALYSIS AND RESULTS
The first step in data analysis for this study was to examine all observations of river gauges at or above flood stage and conduct a monthly division of the data. A monthly distribution of the data allowed for calculation of the frequencies and relative frequencies of observations at or exceeding flood stage for each month. The monthly flood frequency chart (Fig. 1) illustrates that most flood observations come during the month of March, followed by April, while the fewest observations of flooding are found during the month of August. Figure 2 is a seasonal analysis of flood frequency using the standard meteorological seasonal definitions for Winter (December-February), Spring (March-May), Summer (June-August) and Fall (September-November). Figure 2 reveals that just under 55% of all river flooding observations among the 23 river gauges occurred during the spring months.
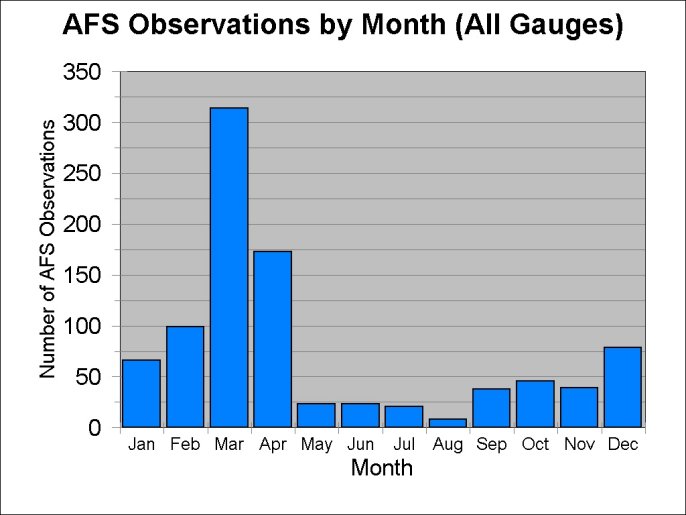
Figure 1: Monthly Total of Above Flood Stage (AFS) Observations.
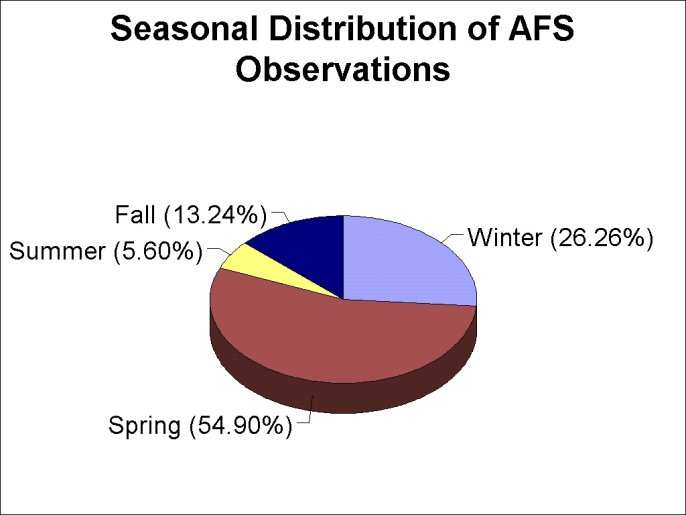
Figure 2: Seasonal Distribution of AFS Observations.
The monthly flood frequency analysis reveals that 33.80% of all flooding observations occurred during the month of March. April had 18.62% of the observations above flood stage, followed by February and December. While this indicates the majority of Central New York flooding occurs during the late winter and early spring months, it describes only the flood frequency. This analysis does not address flood magnitude, which is also important in assessing what time of year the greatest overall flood threat to persons and property exists. It is possible that during the spring months, a number of gauges may rise to or marginally beyond flood stage, while summer and fall flooding could be larger in magnitude.
In order to assess climatological magnitude of flooding, gauge observations were used to determine the height above flood stage (HAFS) during flood events. As illustrated in the chart of monthly median HAFS (Fig. 3), the highest river levels were not observed during the late winter and early spring months, but rather during the late spring, summer and early fall season. July had the greatest HAFS (3.72 ft.), followed closely by August (3.40 ft.). The third and fourth highest months for median HAFS values are June and September, respectively. This implies that while flooding is less frequent during the summer, it is of a greater magnitude.
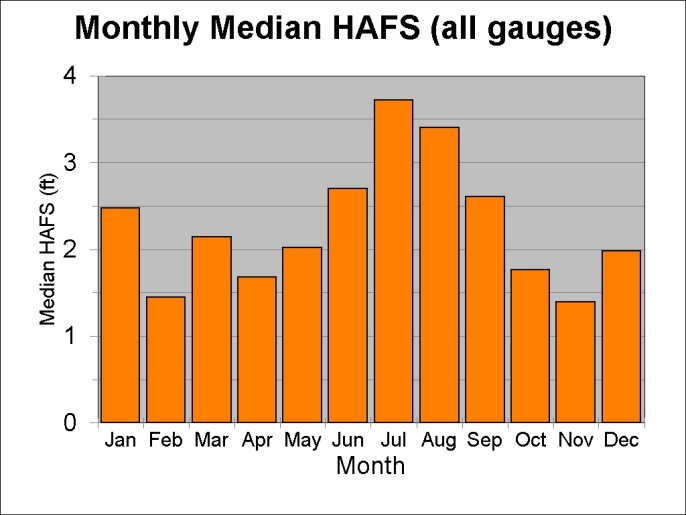
Figure 3: Monthly Median HAFS values for all gauges.
Due to the infrequency of summer flooding, and the higher frequency of springtime flooding, however, the fact that the median HAFS value for spring months is lower may be due to a large number of relatively minor flooding events during the spring, especially compared to the summer. For this reason, the median HAFS observations for each month were normalized. This was done by multiplying the monthly median HAFS by the frequency of flood observations for each month. These values were then multiplied by 10 for scaling purposes (Fig. 4). This normalization was used to account for the large differences in flooding frequency from month to month, thus giving a more accurate representation of which months pose the greatest overall threat for flooding. These normalized values indicate that the spring months, especially March, do pose a significantly higher threat for flooding magnitude than the summer months.
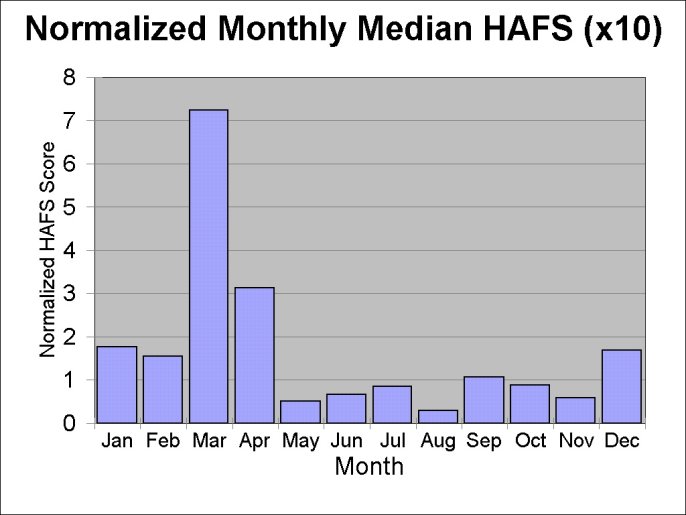
Figure 4: Normalized Monthly Median HAFS Score, multiplied by 10 for scaling factor.
While an examination of river crest heights is important in assessing flood threat, it is also important to consider the areal extent of the flooding. While a measure of square kilometers affected by flooding would be ideal, the limited nature of river gauge data prevents such an in-depth analysis. Instead, to approximate the areal scope of flooding, an examination was made of the number of gauges at or above flood stage for each flood event. A flood event, for the purpose of this study, was defined as one or more gauges reaching flood stage. Figure 5 shows the mean number of gauges above flood stage per flood event, by month. Note, the values in Figure 5 are conditional means for each month, meaning the value represents the average number of river gauges that reached or exceed flood stage when flooding occurred during the specified month. It should be noted that the gauge observations are not totally independent in nature, especially points that are on the same river. While the river gauge locations are relatively close to one another, however, subjective evaluation indicated that they appear to have some degree of independence during flooding events. This is likely as a result of the varying topography and hydrological conditions in the sub-basin above each gauge. A statistical analysis to assess the degree of any dependence among the gauges was not yet performed.
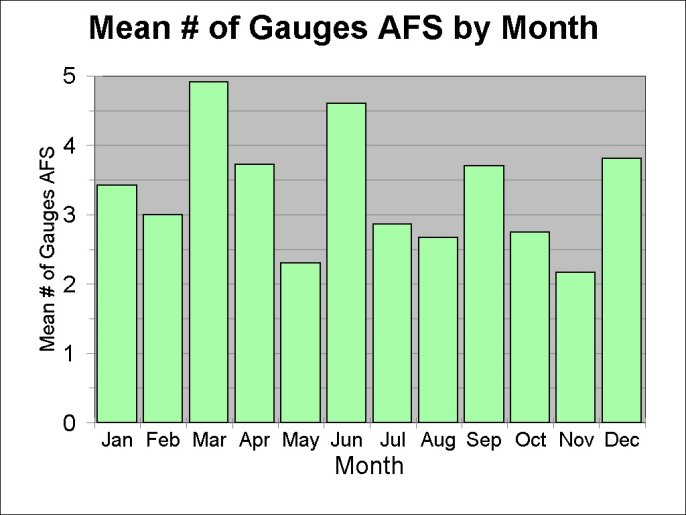
Figure 5: Mean Number of Gauges above flood stage for flood events by month.
As expected, there was a large variability between monthly event totals, ranging from 67 in March to only 3 events in August. Therefore, the data in figure 5 was also normalized to give a more accurate perspective of the climatological area coverage during flood events (Fig. 6). The normalizing procedure was analogous to the one described previously, but without the scaling multiplication. The normalized score chart in Figure 6 shows that March appears to have the greatest areal extent of river flooding, as well as the highest median HAFS (Fig. 4).
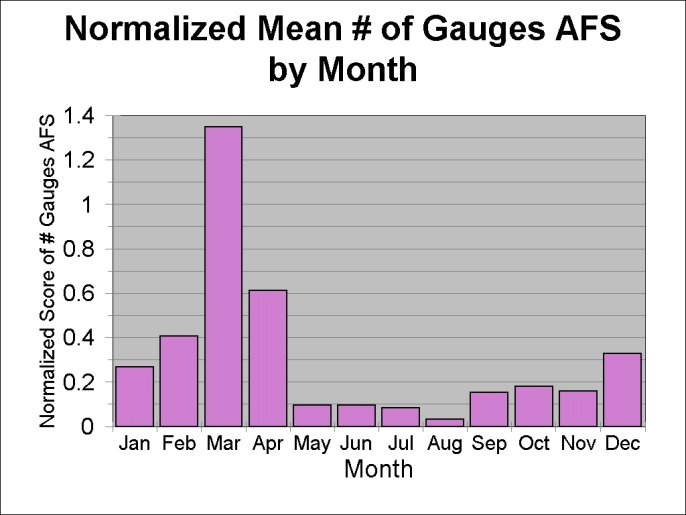
Figure 6: Normalized Score of Monthly Number of Gauges AFS
Having determined the favorable months for largest HAFS and for greatest area coverage of flooding, the final step of this preliminary analysis is to make a determination on where flooding is typically occurring -- specifically which areas are most susceptible to the greatest HAFS. Before the results are presented, it must be noted that the volume of water needed to raise the river 1 foot above flood stage can vary considerably for each gauge location (e.g., it might take twice as much water to raise the stage from flood stage to 1 foot above flood stage at Gauge A than it does at Gauge B). This is dependent upon the shape of the river channel, and the topography of the land along the river in the vicinity of the gauge. Also, the public impact of a river gauge 1 foot above flood stage is vastly different at each point, since each location has different degrees of development near the river. Therefore, these results cannot be directly used to assess whether certain communities face greater threat from river flooding than others. The following analysis pertains only to the frequency of, and the degree to which, each river gauge rises above flood stage during flooding events.
Median HAFS for each river gauge over the course of the entire year were calculated (Fig. 7). The Conklin and Bainbridge gauges on the Susquehanna River produced the highest HAFS median values of 6.76 feet and 4.83 feet, respectively. These were followed by Elmira on the Chemung River at 4.0 feet. (Note, the city of Elmira is protected by levees to 13 feet above the flood stage. However, flooding does occur in some neighboring communities when the Elmira gauge on the Chemung River reaches the designated flood stage.)
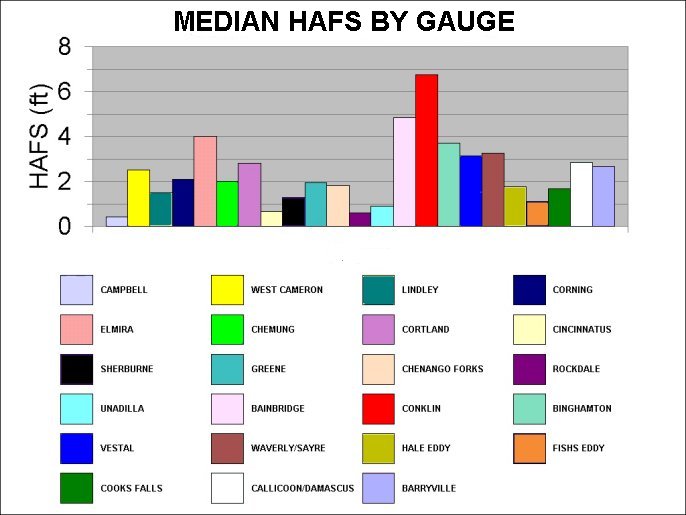
Figure 7: Annual Median HAFS by Gauge Location
As with the monthly climatology, a rather large discrepancy in flood frequency values exists for the individual gauge locations. Therefore, the data was again normalized by multiplying by the relative frequency of flood stage observations at each location, then multiplied by 100 for scaling purposes (Fig. 8). This data set reveals that the greatest potential threat for largest HAFS is present at the Conklin flood gauge, while the HAFS threat at Bainbridge and Elmira drops considerably from the non-normalized values. After normalization, the Waverly/Sayre gauge on the Susquehanna River has the second largest normalized HAFS score, followed by Vestal (Susquehanna River) and Cortland (Tioughnioga River).
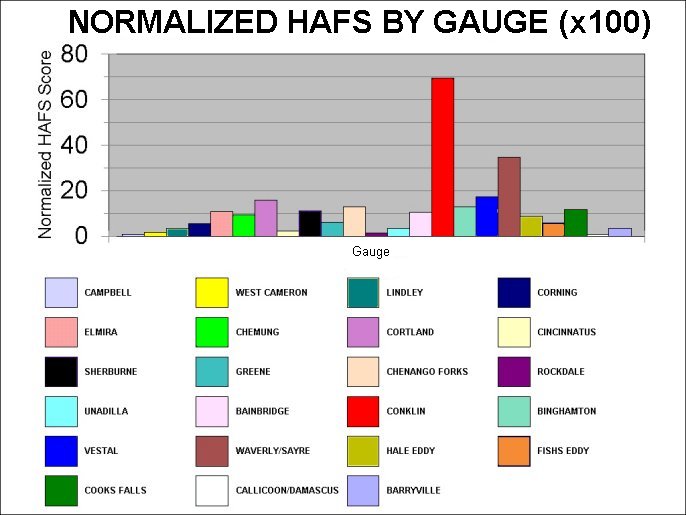
Figure 8: Normalized Annual HAFS Score by Gauge Location (x 100)
Normalized ranking scores (as a function of percentage of all events) are listed below for monthly median HAFS; monthly mean number of gauges AFS; and HAFS by gauge location.
Normalized Monthly Median HAFS Ranking and associated percentage of normalized score distribution (Flooding magnitude by month):
- March (35.85%)
- April (15.51%)
- January (8.73%)
- December (8.35%)
- February (7.66%)
- September (5.29%)
- October (4.32%)
- July (4.17%)
- June (3.31%)
- November (2.89%)
- May (2.48%)
- August (1.44%)
- March (35.92%)
- April (16.27%)
- February (10.81%)
- December (8.73%)
- January (7.10%)
- October (4.80%)
- November (4.26%)
- September (4.04%)
- May (2.51%)
- June (2.51%)
- July (2.18%)
- August (.87%)
- Conklin (26.61%)
- Waverly/Sayre (13.33%)
- Vestal (6.62%)
- Cortland (6.08%)
- Chenango Forks (4.91%)
- Binghamton - Wash. St. (4.90%)
- Cooks Falls (4.50%)
- Sherburne (4.20%)
- Elmira (4.14%)
- Bainbridge (4.00%)
- Chemung (3.58%)
- Hale Eddy (3.41%)
- Greene (2.34%)
- Fishs Eddy (2.23%)
- Corning (2.08%)
- Barryville (1.33%)
- Unadilla (1.33%)
- Lindley (1.31%)
- Cincinnatus (.89%)
- West Cameron (.62%)
- Rockdale (.53%)
- Callicoon/Damascus (.35%)
- Campbell (.34%)
A relative flood threat maximum during the month of March in central New York is not a surprise. Typically, March is the month during which snowmelt is occurring in conjunction with climatologically warming daily average temperatures. A greater percentage of precipitation also falls as rain, which further aids snowmelt, and with the ground often still at least partially frozen, especially at deeper layers, this results in considerable runoff into streams, creeks and rivers. The contribution of snowmelt during the spring months is likely a major factor in the 55% spring seasonal distribution of above flood stage observations. Winter flood events are typically a result of heavy rain falling on frozen ground (sometimes combining with an early snowmelt), and/or ice jams in the rivers. The infrequency of flooding during the summer months corresponds well with an increase in soil absortivity and percolation compared to the winter and early spring. River and stream base flow are also typically lower during the summer and early fall due to increased evaporation caused by the warmer temperatures, and especially the removal of ground water by vegetation.
The increased median of HAFS (Fig. 3) during the summertime flooding events are most likely due to excessive rainfall resulting from tropical systems, though some of the summer flood events may be a result of repeated and/or intense thunderstorm events over portions of the region. Note, this study only examined river flooding - localized flash flooding events of smaller non-gauged streams and creeks were not accounted for, and may have different climatologies.
Another relative maximum in median HAFS occurs during the month of January. This could be a result of the widespread extreme January 1996 flooding skewing the data.
With regard to flooding at specific gauge locations, the relative median HAFS were altered at a number of locations when the data was normalized. Some locations such as: Elmira; West Cameron; Binghamton at Washington St.; Vestal; Callicoon/Damascus; and Barryville, featured a substantial drop in score relative to other locations from median HAFS to normalized HAFS. This drop seems to indicate that these locations do not flood often, but have a tendency to exceed flood stages by a great amount when they do flood.
4. SUMMARY AND FUTURE WORK
Based on the normalized scores, the month of March ranks first for threat of both height above flood stage and areal coverage by flooding. Summer months tend to feature very few river flooding events, but those that do occur tend to be large in magnitude. Several gauge locations in Central New York also follow this pattern, exhibiting low river flood frequency but a relatively high median height above flood stage.
This analysis has allowed for a climatological monthly evaluation of flood threat, in regard to both areal coverage and height above flood stage, as well as the opportunity to select locations most susceptible to flooding. When using the normalized scores in conjunction with the unaltered data, trends in the observations become more apparent in regard to locations and months that feature infrequent flooding, yet result in substantial height rises above flood stage during flood events.
A next logical step in developing a comprehensive river flood climatology involves examining the synoptic and mesoscale atmospheric conditions preceding and during river flooding events. Also, the frequency and degree to which antecedent conditions factor into flood events needs to be examined. Examples of these factors include: how much snow was on the ground preceding and at the time of flooding; the water equivalent of that snow; the "ripeness" of the snow pack, which impacts whether rainfall will accelerate the melting of the snow, or the snow pack will absorb the rain; whether or not the ground was frozen; the amount of precipitation over the preceding week/months (i.e., soil moisture), and the state of vegetative development in the region (e.g., whether regional plant growth has resumed in the spring, or entered dormancy in the fall).
Special thanks to Mark Wysocki (Cornell University) for his continued guidance and encouragement, and to John Chiaramonte (National Weather Service Forecast Office, Binghamton, NY) for their direction and assistance.