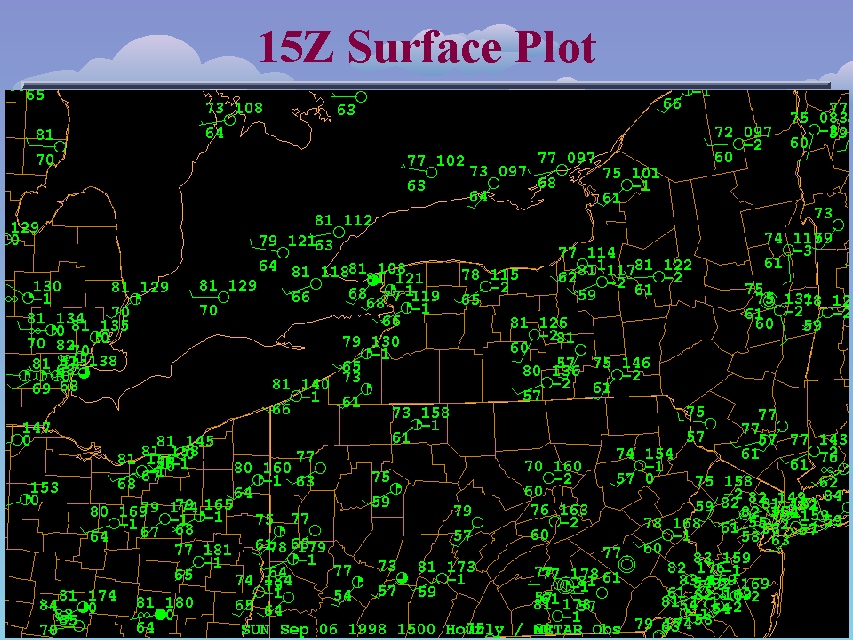
15Z Surface Plot
Slide 14 of 52
The 15Z Surface plot indicates that daytime heating is begining to mix the boundary layer and break the low level inversion. Surface dew points are starting to rise across western and central Pennsylvania and western New York as the low level moisture advances to the northeast and begins to mix down to the surface. Also, the temperature at ELM has risen from 52 to 80 in only 3 hours.


