| Created with the Web Accessibility Wizard |
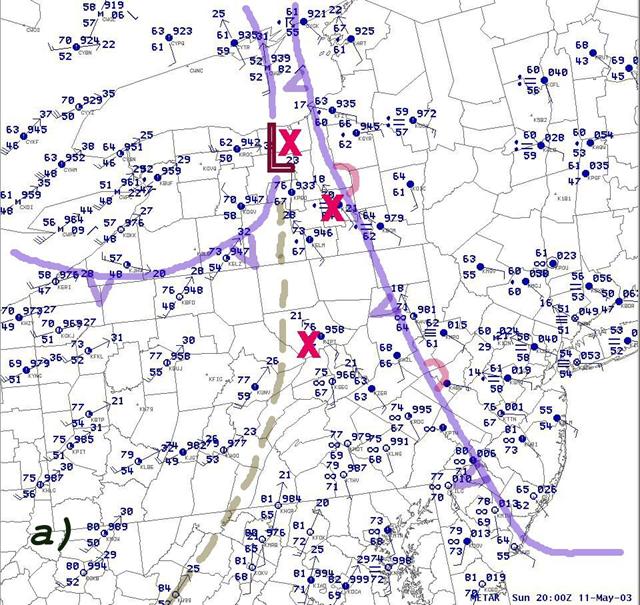
Surface analysis at 20 UTC. X's mark location of significant storms.
Slide Links:
Speaker Notes:
Surface analysis at 20 UTC. Note the narrow warm sector over central Pennsylvania and central New York. Significant storms are developing near the boundaries in the warm sector.