| Created with the Web Accessibility Wizard |
Slide Links:
Speaker Notes:
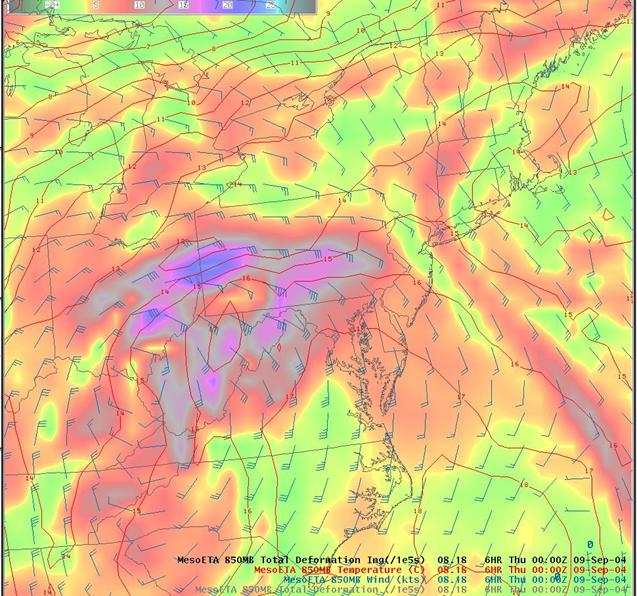
This plan view map shows the strong 850 mb temperature gradient, and strong deformation pattern associated with the frontogenesis over western Pennsylvania and eastern Ohio at 00 UTC. Again, note that the strongest deformation, along a strong temperature gradient, was directly associated with the location of the heavy rain band.