| Created with the Web Accessibility Wizard |
Slide Links:
Speaker Notes:
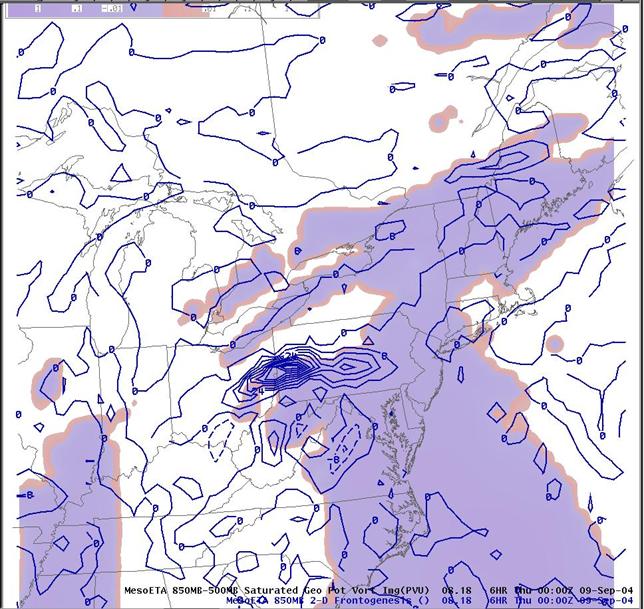
This plan view map shows the maximum of 850 mb frontogenesis located over southwest Pennsylvania at 00 UTC. The blue shading is negative EPV in the 850 to 500 mb layer. This figure implies that a large area of mid-level instability was located along and south of the frontogenesis maxima. The strong east-southeast flow below 500 mb was drawing this unstable air northwestward, up and over the frontal boundary.