| Created with the Web Accessibility Wizard |


Slide Links:
Speaker Notes:
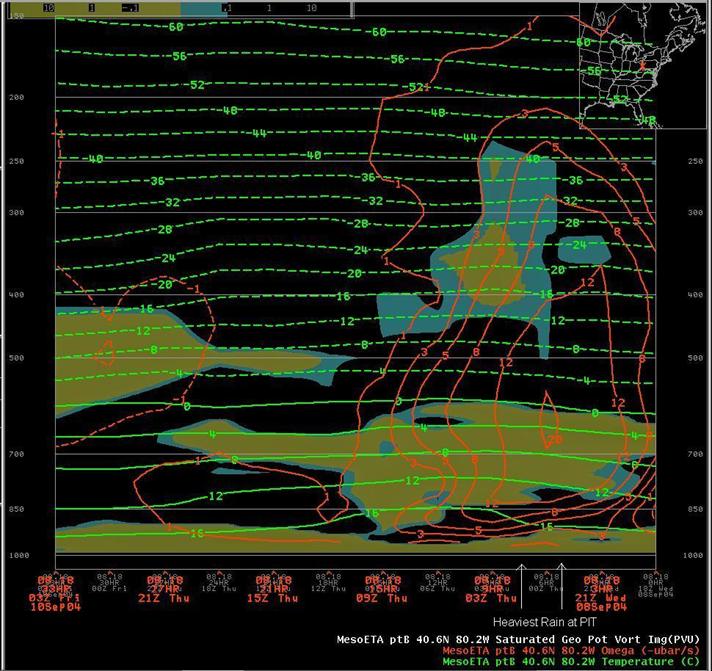
This time-height diagram and Pittsburgh shows the maxima of omega and mid-level instability (shaded) moving across the station at the time of heaviest rain (around 00 UTC on the 9th). The temperatures contours indicate a freezing level just below 600 mb.