| Created with the Web Accessibility Wizard |
Slide Links:
Speaker Notes:
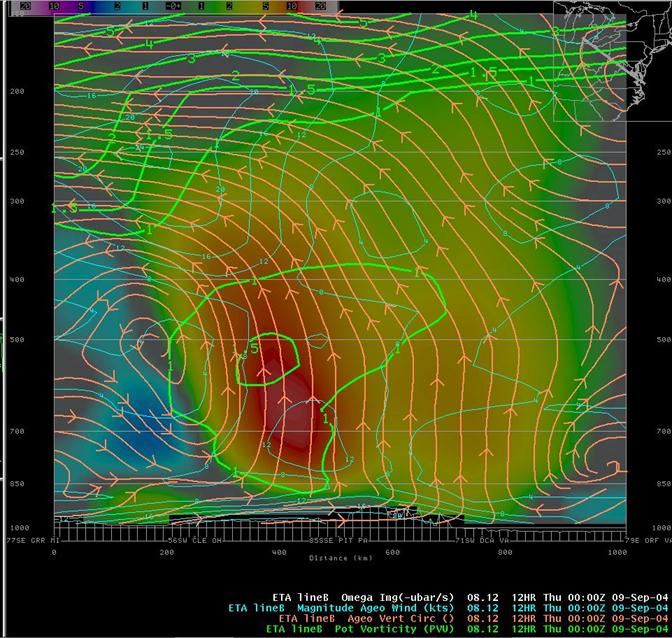
This cross-section (taken from the Delmarva area to southeast Michigan) shows a potential vorticity maximum in the mid-troposphere centered over southwest Pennsylvania at 00z on the 9th. Enhanced ageostrophic outflow, toward the northwest, is indicated by the red arrows, and by the blue contours, which indicate the magnitude of the ageostrophic wind. The strong outflow aloft likely lead to an enhanced upper-level jet northwest of the surface cyclone. Strong upward vertical motion (red shading) is co-located with the potential vorticity maxima.