Time height diagram of omega and theta-e lapse rate at AVP
| Created with the Web Accessibility Wizard |
|
Time height diagram of omega and theta-e lapse rate at AVP |
|
|
Slide Links:
Speaker Notes:
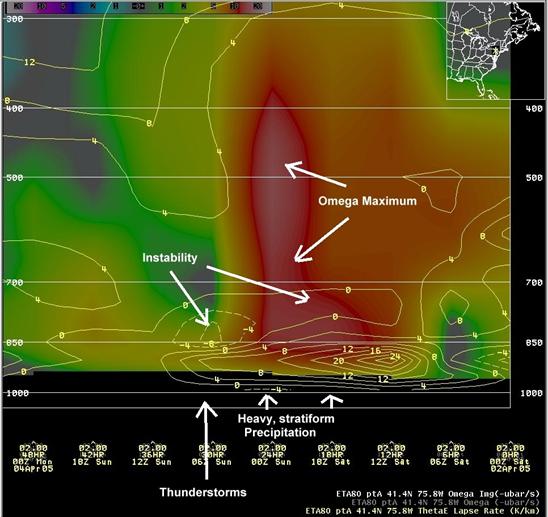
This time-height diagram of omega and theta-e lapse rate at AVP shows how both of those parameters evolved, as the rainfall at AVP transitioned from heavy stratiform rain around 00 UTC on the 3rd, to convective by 06 UTC. Weak, mid-level instability is associated with strong upward vertical motion during the time of the heavy stratiform rain, while more pronounced instability, but weaker upward vertical motion, was evident during the time of the thunderstorms.