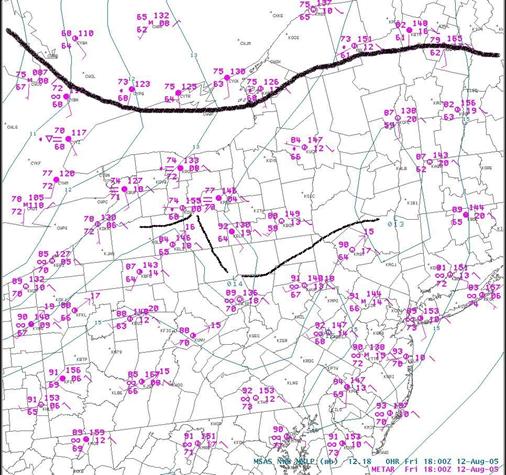
MSAS sea-level pressure and surface plot at 8/12 18z
| Created with the Web Accessibility Wizard |
|
MSAS sea-level pressure and surface plot at 8/12 18z |
|
|
Slide Links:
Speaker Notes:
A closer look at the observations indicates that there may have a series of boundaries south of the large-scale warm front, across northern Pennsylvania and southern New York. Note the pressure trough extending south from near ROC south to around IPT. There is also a strong dew point gradient from IPT and AVP north to BGM.