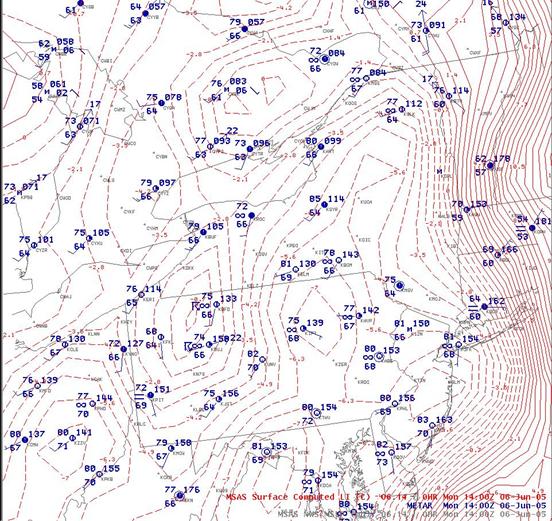
Surface plot and MSAS analysis of lifted index at 14 UTC 6/6/05.
| Created with the Web Accessibility Wizard |
|
Surface plot and MSAS analysis of lifted index at 14 UTC 6/6/05. |
|
|
Slide Links:
Speaker Notes:
Meanwhile, the atmosphere was becoming very unstable downstream of the developing system. The data on this slide shows lifted indices of -7 developing across central Pennsylvania and southern NY at 14 UTC.