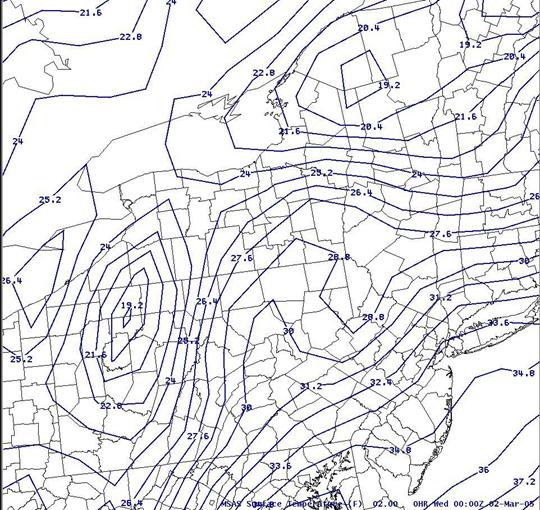
MSAS surface temperatures 3/2 00 UTC.
Long Description:
| Created with the Web Accessibility Wizard |
|
MSAS surface temperatures 3/2 00 UTC. |
|
Long Description: |
Slide Links:
Speaker Notes:
This MSAS plot shows an analysis of surface temperatures at 00 UTC on the 2d. Note that the surface temperature gradient over central New York is not nearly as strong as the 900 mb temperature gradient. In this case, the surface temperature gradient was likely being disrupted by terrain effects. As a result, the strongest frontogenesis in this case was not at the surface, but just above the surface.