First page Back Continue Last page Research
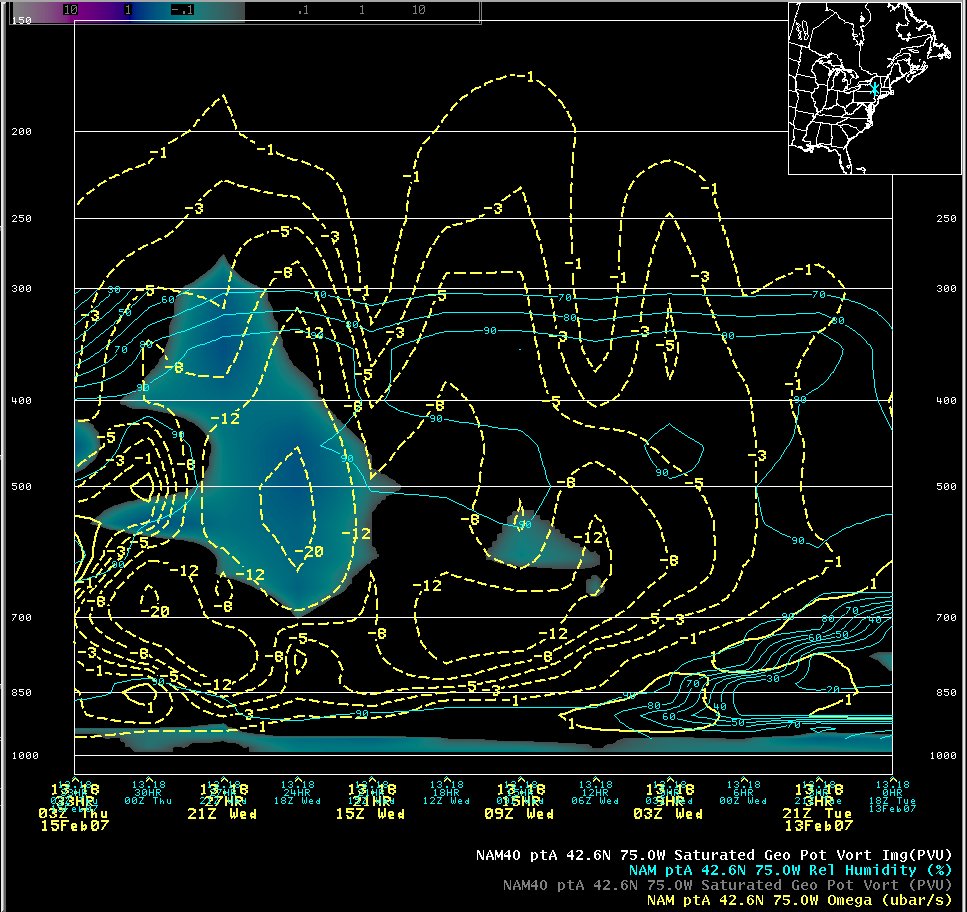
Time-height diagram of omega and negative EPV* (shaded) (February 13, 18 UTC 0-24 hr NAM forecast)
Notes:
This time-height plot was taken at the location where some of the heaviest snow was observed (the western Catskill mountain region). Note a prolonged period of strong lift across the area, beginning around 00 UTC on the 14th. The lift became most intense when it became co-located with a deep region of EPV* (shaded blue), between 18 UTC on the 14th and 00 UTC on the 15th.