Omega / EPV time-height diagram
Notes:
This time-height diagram, from the 12 UTC, November 18 NAM shows the forecast evolution of upward vertical motion (yellow contours) and negative EPV (blue shading) at a point over northeast Pennsylvania, near Avoca. Note the prolonged period of significant (greater than 8 micro-bars / s) upward vertical motion co-located with negative EPV. This is a potential heavy snow signature.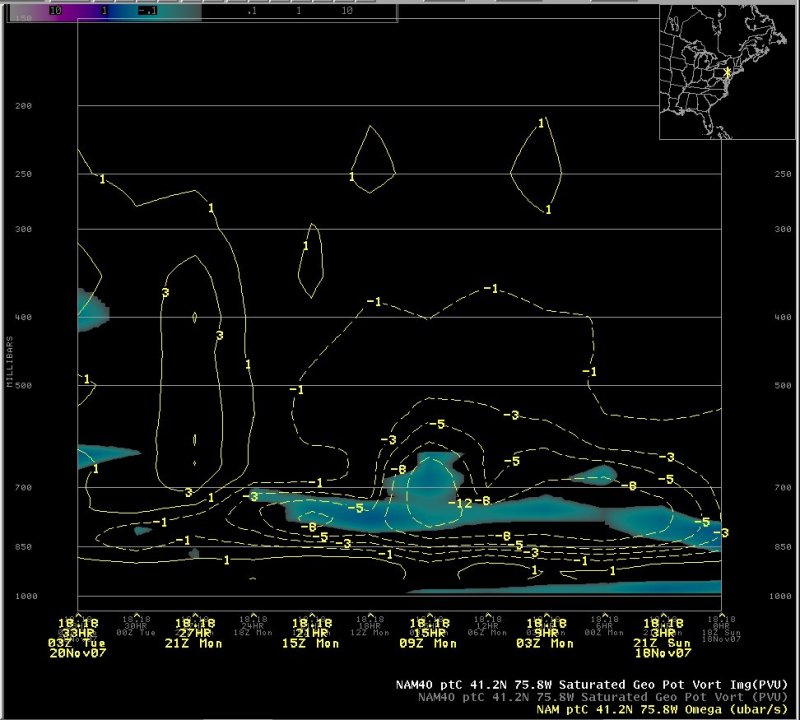
Slide 13