RUC frontogenesis and omega time height diagrams
Notes:
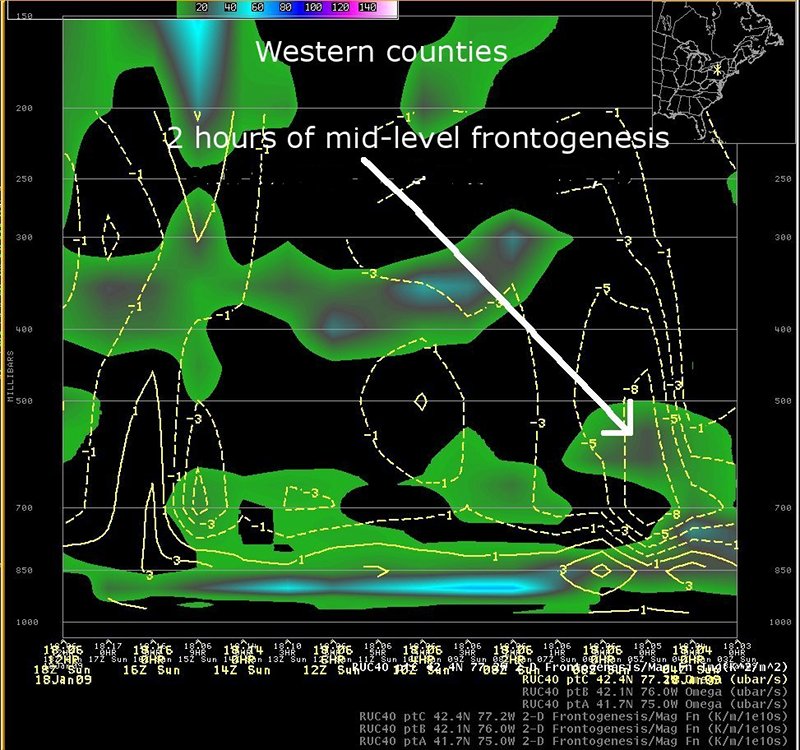
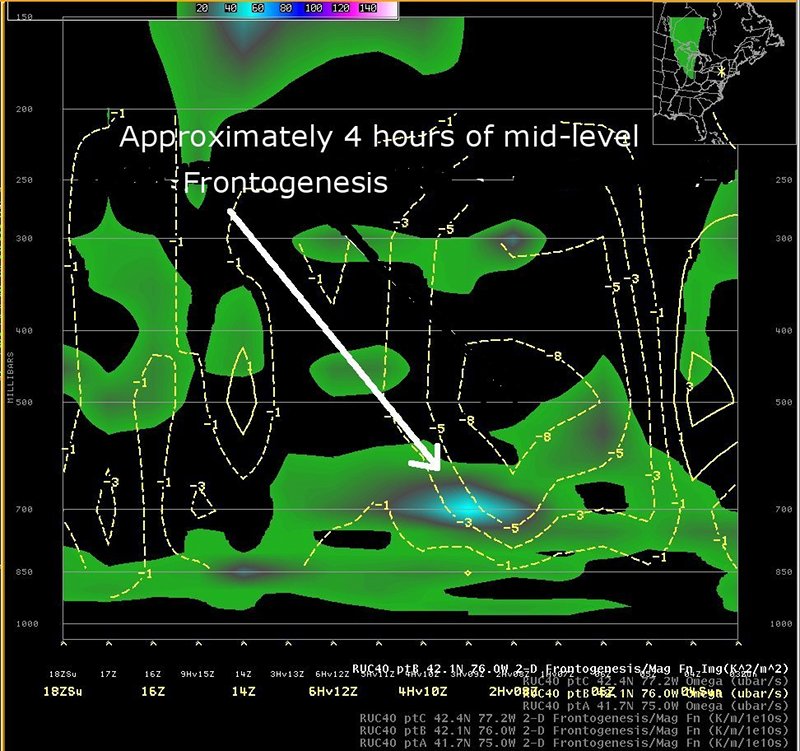
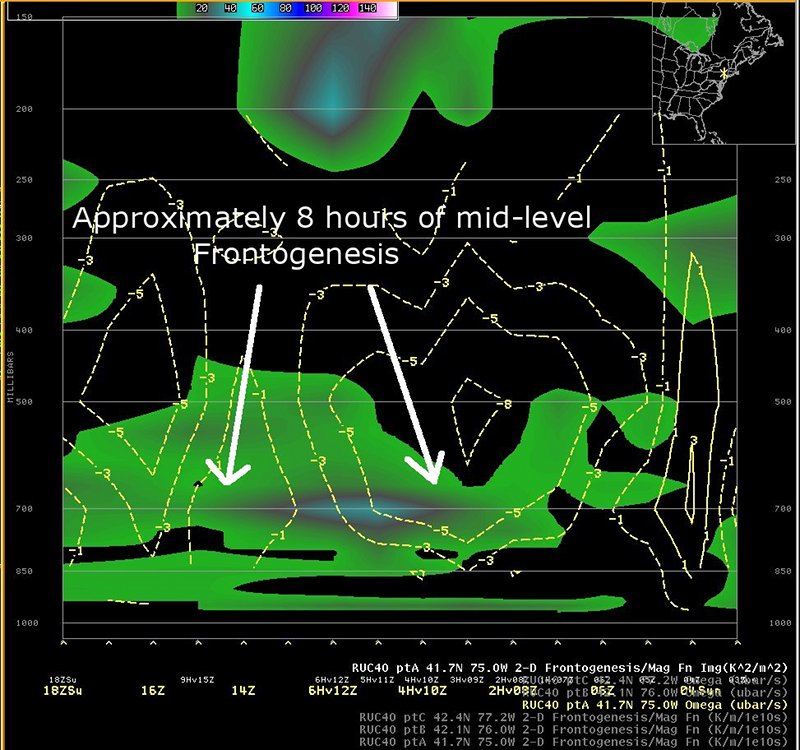
The images on this slide show time-height diagrams of frontogenesis and vertical motion at 3 points in the county warning area. The first image shows the data at a point in west central New York. The second image shows the data at a point approximately 100 miles east of the first point, in south central New York. The third image shows the data at a point approximately 100 miles east of the second point, in southeast New York. At the western point, the mid-level frontogenesis and associated upward vertical motion was very brief. The mid-level frontogenesis and upward vertical motion lasted longer at the central and eastern points, especially the eastern point.|
Switch images by moving your mouse pointer over the links below...
Image 1 Image 2 Image 3 |
|
Slide 28