Wind nomograms
Notes:
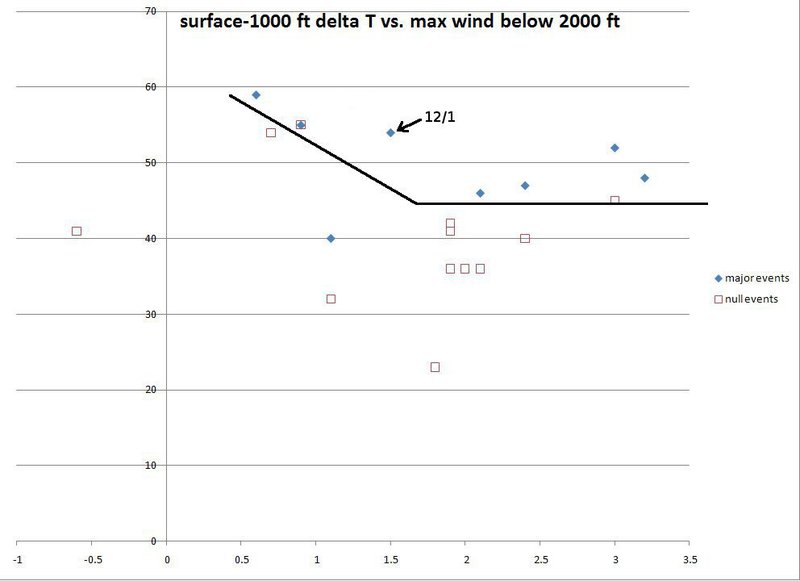
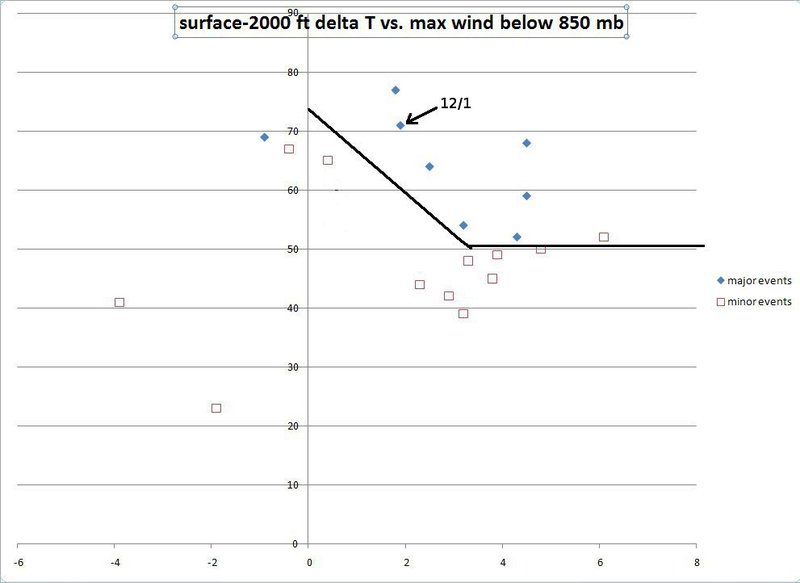
The nomograms on this slide are based on observations and RUC forecast soundings from several recent southeasterly flow events in our area. The events plotted as open squares were minor events, when area METARs did not indicate peak winds above 35 kts. The events plotted as blue diamonds were more significant, and were associated with peak winds of at least 40 kts on area METARs. The data on the slides indicate that observed, peak surface winds are a function of low-level lapse rates and low-level winds. Significant events tend to occur when lapse rates are relatively large and low-level winds are large. The data from December 1st, 2010 were within the “major event” portion of these graphs.
|
Switch images by moving your mouse pointer over the links below...
Surface-1000 feet delta T vs Max Wind Below 2000 feet Surface-1000 feet delta T vs Max Wind Below 850 mb |
|
Slide 11