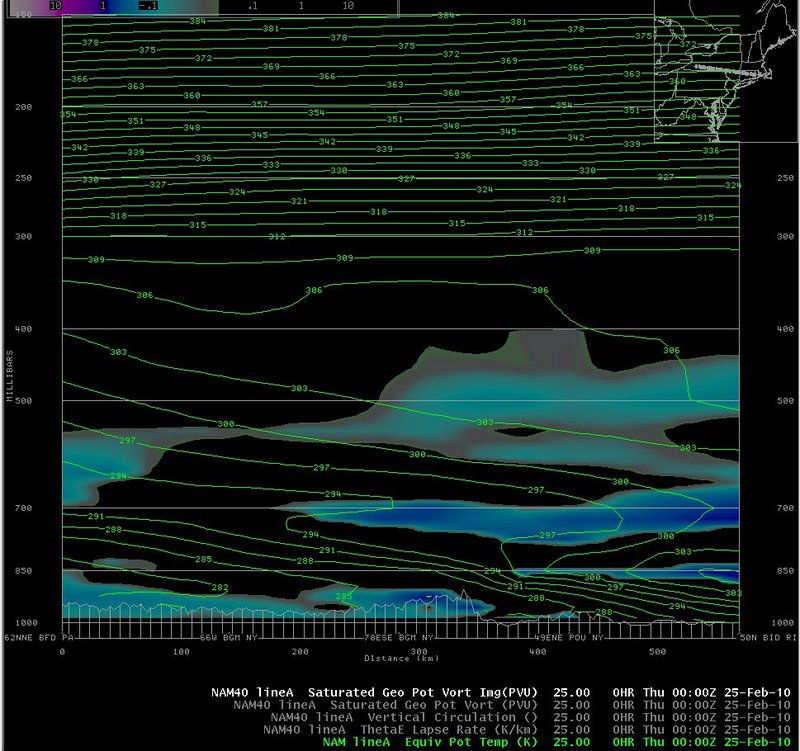
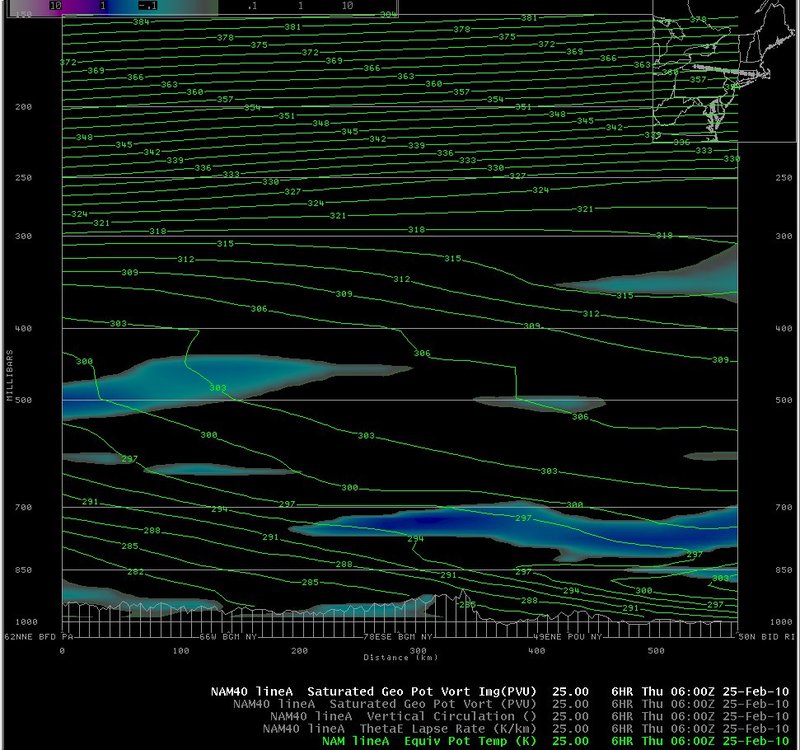
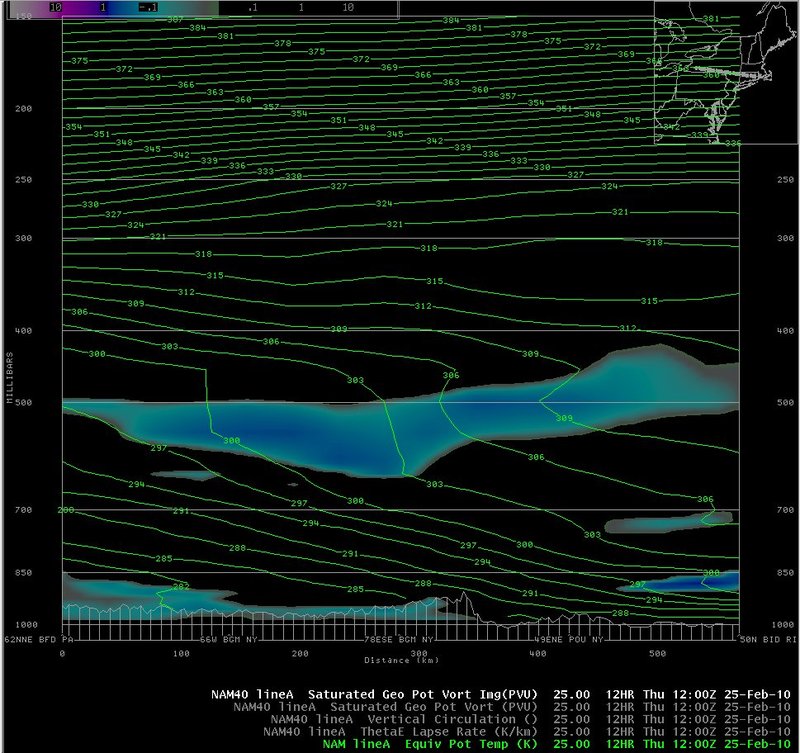
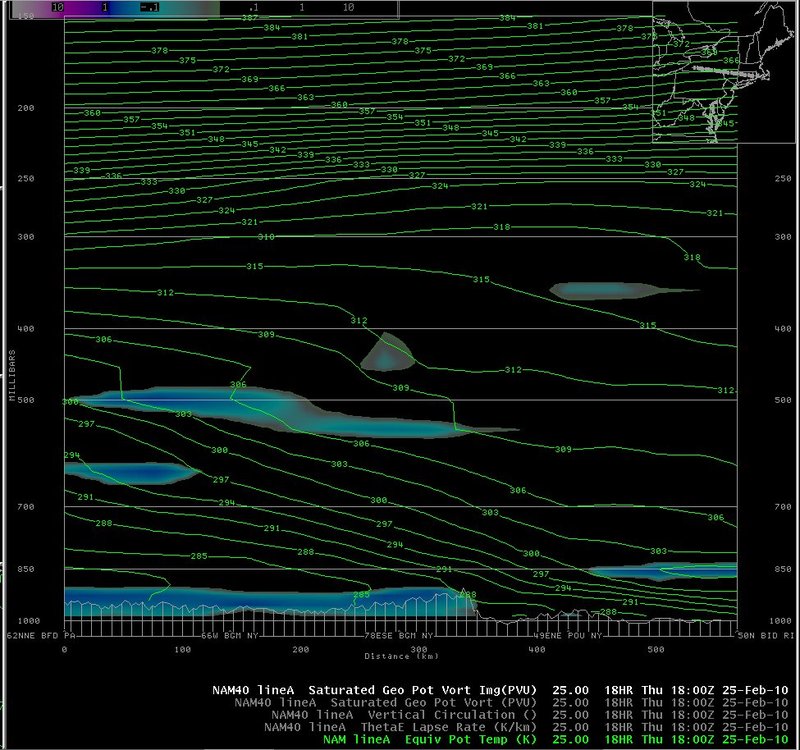
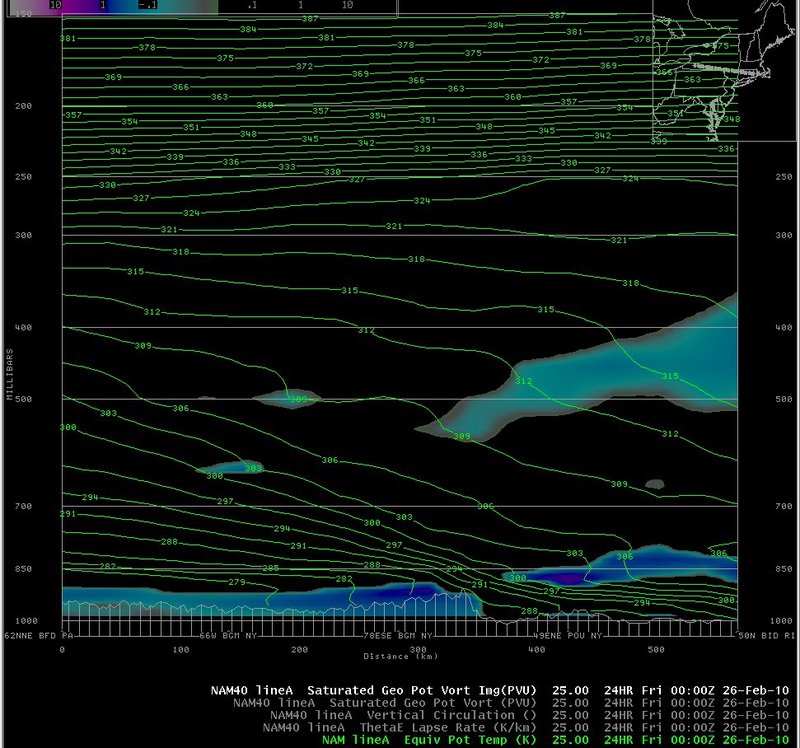
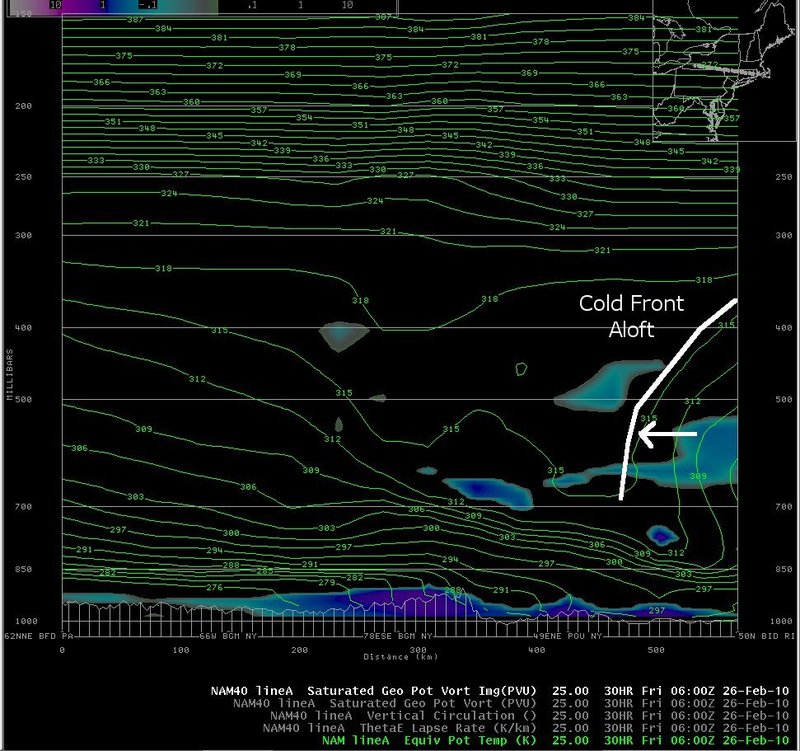
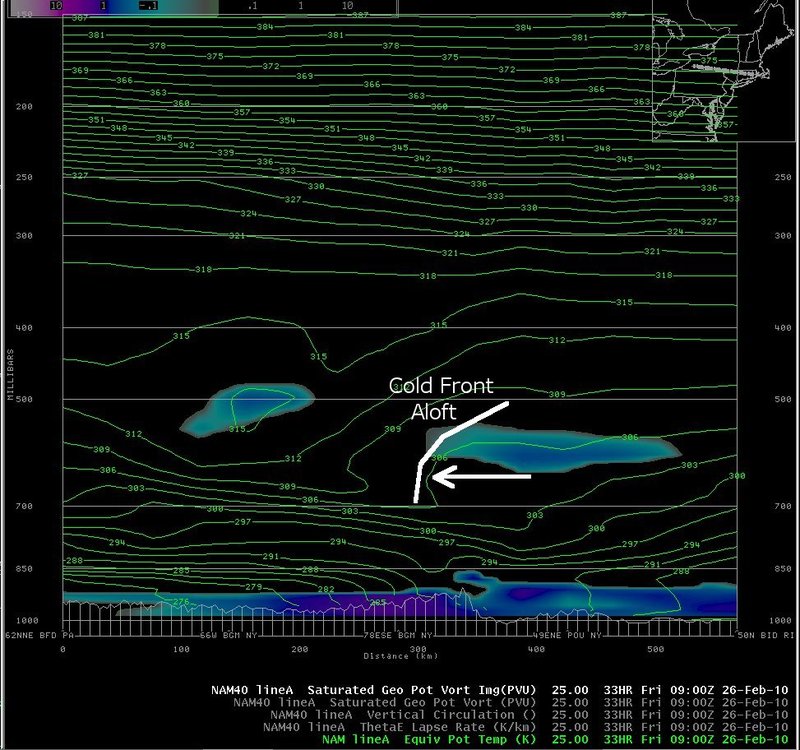
Theta-e and EPV cross sections
Notes:
The data on these slides is similar to what was shown on the previous slides, except that instability is shown by displaying negative values of geostrophic saturation equivalent potential vorticity.|
Switch images by moving your mouse pointer over the links below...
Valid Thu 0000 UTC 25-Feb-2010 Valid Thu 0600 UTC 25-Feb-2010 Valid Thu 1200 UTC 25-Feb-2010 Valid Thu 1800 UTC 25-Feb-2010 Valid Fri 0000 UTC 26-Feb-2010 Valid Fri 0600 UTC 26-Feb-2010 Valid Fri 0900 UTC 26-Feb-2010 |
|
Slide 18