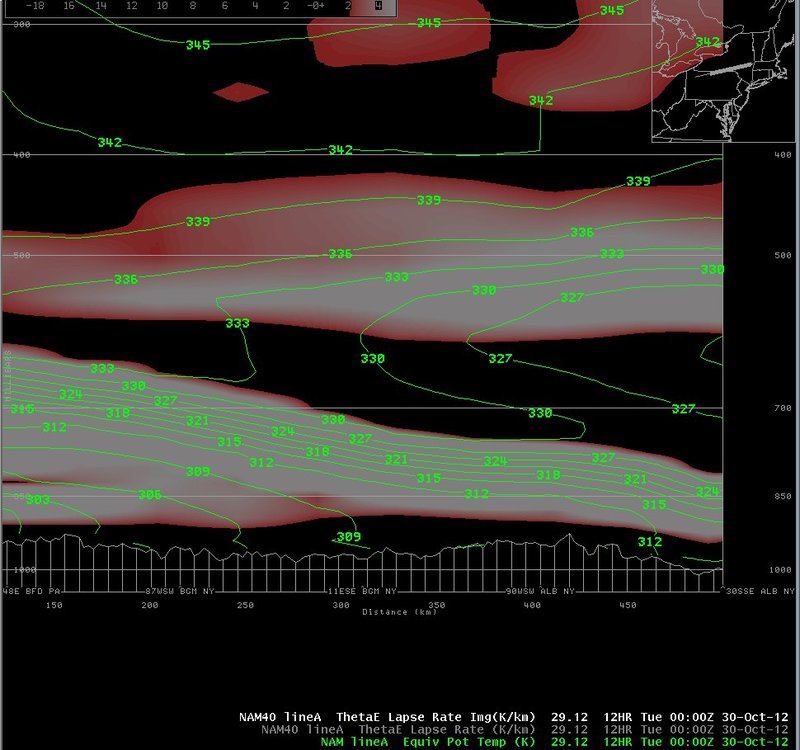
Equivalent potential temperature and lapse rate (stable layers shaded)
Notes:
The change in stability can be seen by looking at the data on these east-west cross-sections, taken from eastern into central New York. Stable layers are shaded.Switch images by moving your mouse pointer over the links below...
[0000 UTC 30-Oct-2012]
[0300 UTC 30-Oct-2012]
[0300 UTC 30-Oct-2012]
|
![[0300 UTC 30-Oct-2012]](slide29b.jpg)
![[0300 UTC 30-Oct-2012]](slide29c.jpg)
Slide 29