Analogs
Notes:
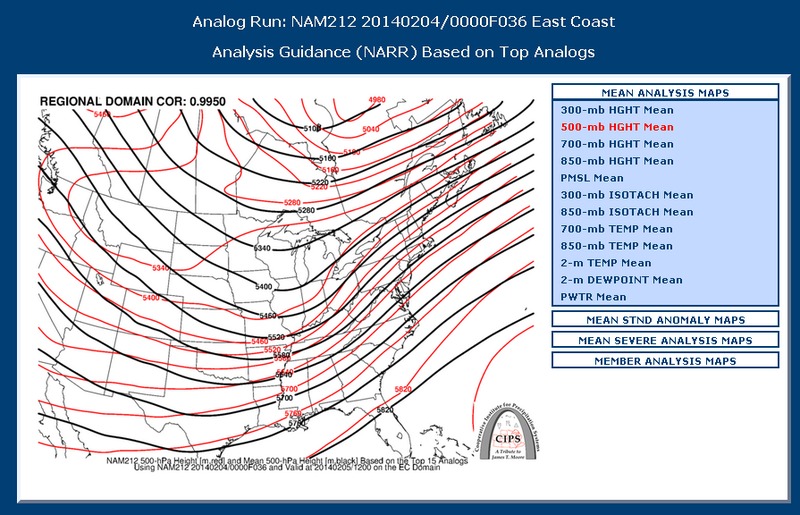
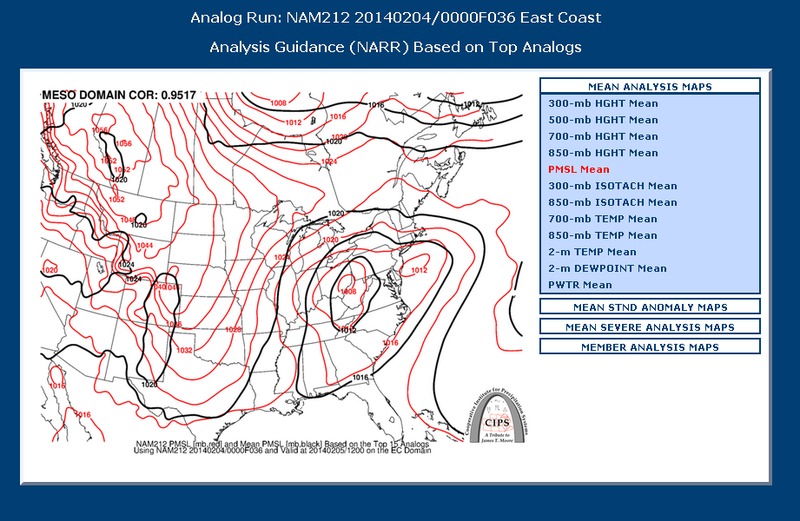
The data on these slides show mean 500 mb heights and mean sea-level pressure from 15 historical analogs for this case. The analogs were identified by an algorithm developed at Saint Louis University and displayed on their CIPS web-site. The black contours are means from the analogs and the red contours are NAM forecasts for this event. Key features are a primary low pressure center over the upper Ohio Valley with a secondary low pressure along the mid-Atlantic coast, and a southwest flow aloft.
Switch images by moving your mouse pointer over numbered buttons...
|
|
|
Slide 10