Time-height diagrams
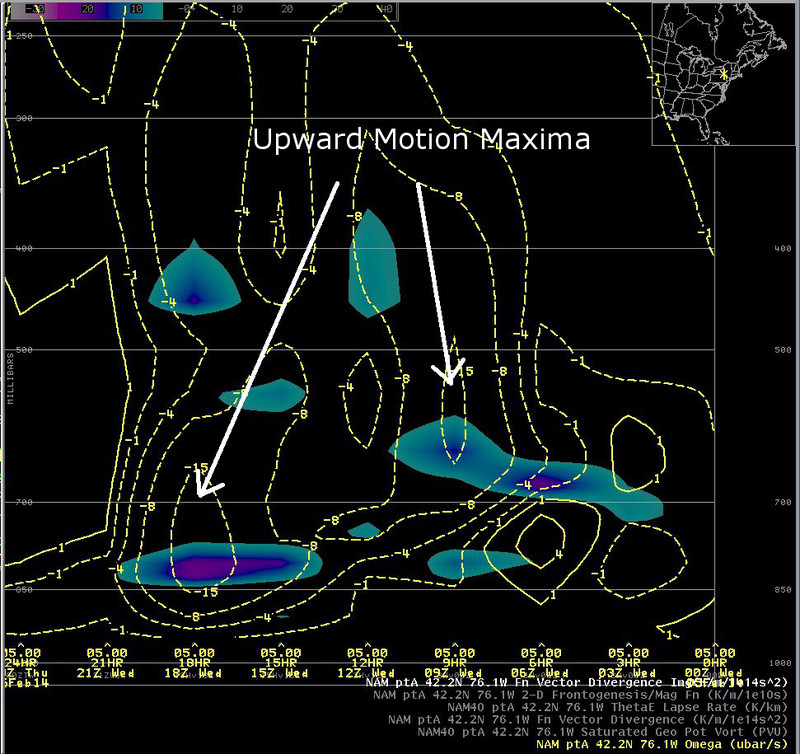
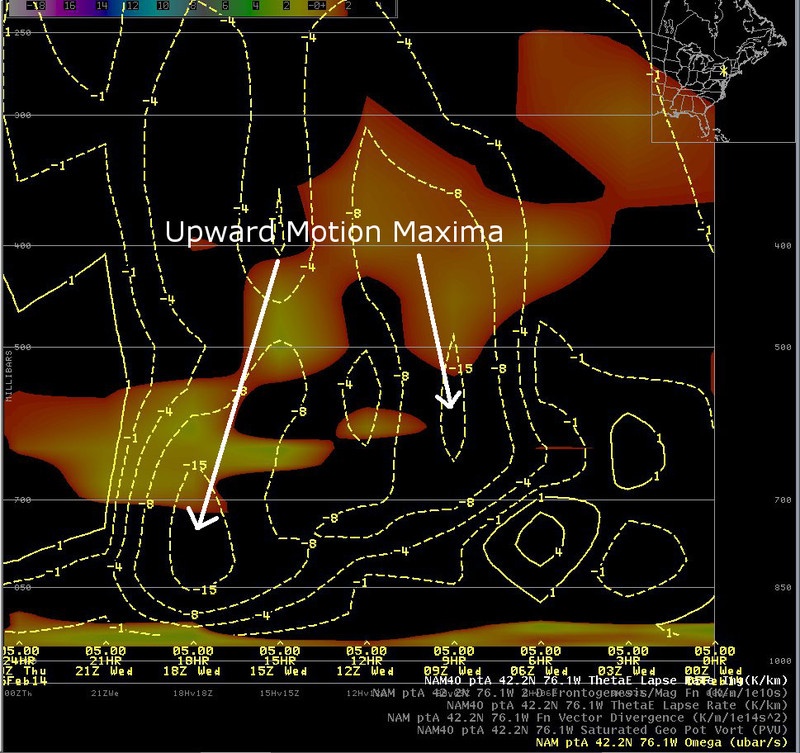
Vertical motion and Fn vector convergence (convergence shaded) left, vertical motion and lapse rate (values below 2 degrees C per km shaded) right.
Notes:
Time height diagrams taken at Binghamton show patterns of vertical motion during the storm. Two maxima of upward motion can be seen, one centered around 09z, and a second centered around 18z. The shaded field on the image to the left is Fn vector convergence, which is a measure of forcing for upward motion due to frontogenesis. The shaded field to the right is lapse rate less than 2 degrees C per km. The image on the left shows the close relationship between upward vertical motion and frontogenesis during this case. The image on the right shows that upward vertical motion was co-located with reduced stability, which would lead to enhanced snow banding.
Switch images by moving your mouse pointer over numbered buttons...
|
|
|
Slide 9