SPC 700 mb frontogenesis and 650-500 mb EPV - 12z to 15z
Notes:
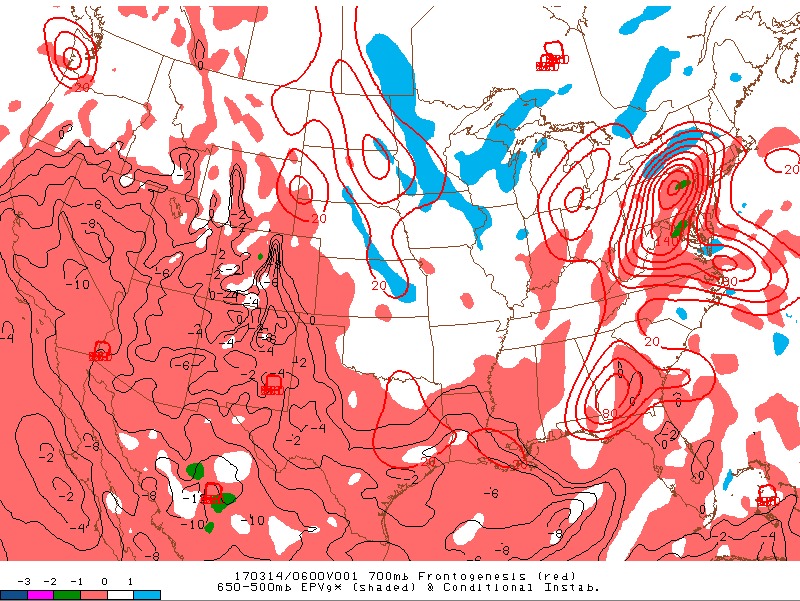
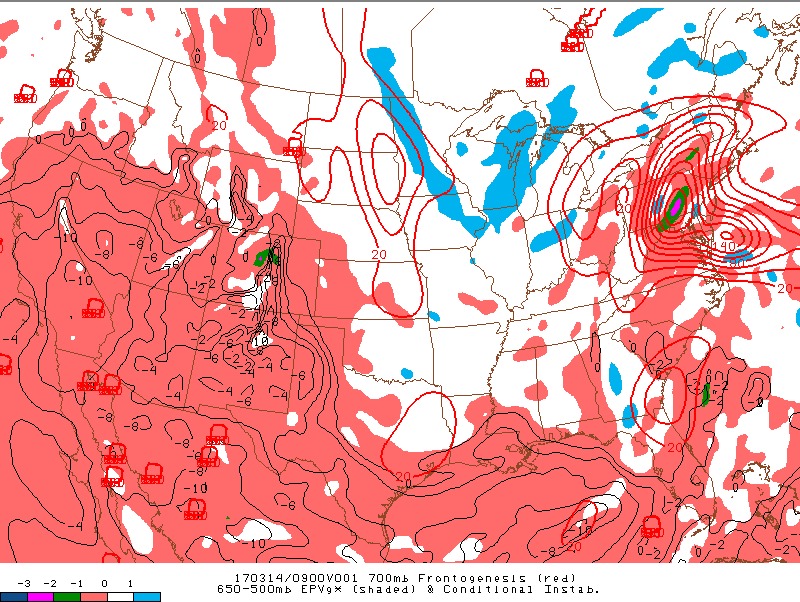
The next few slides show the juxtaposition of 700 mb frontogenesis with 650-500 mb EPV during the evolution of the storm, as indicated by the SPC meso-analysis. At 06z (left), a maxima of frontogenesis (red contours) can be seen over northeast Pa, juxtaposed with EPV values as low as -1 to -2 (shaded). At 09z, EPV values juxtaposed with the frontogenesis have fallen to -2 to -3.
Switch images by moving your mouse pointer over numbered buttons...
|
|
|
Slide 45