| Created with the Web Accessibility Wizard |
Time Height Charts – temperature advection and temperature
October 25th
January 2nd
Slide Links:
Speaker Notes:
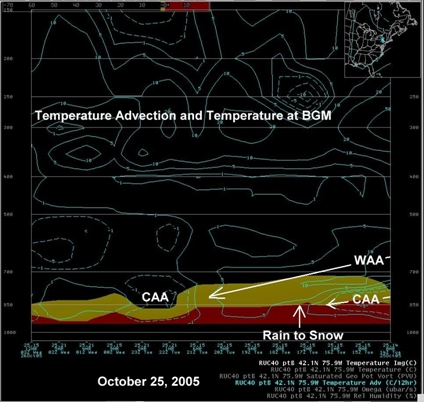
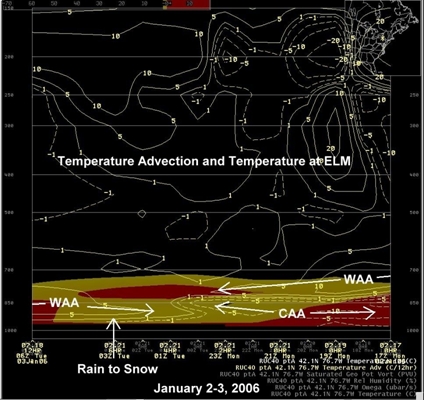
The data on these charts compares the patterns of model forecast temperature advection at BGM on October 25th, to the patterns of model forecast temperature advection at ELM on January 2-3. Temperatures above 0 degrees C are shaded red, and temperatures between 0 and 2 degrees C are shaded yellow. In both cases, the RUC model was forecasting weak temperature advection patterns around the time when rain changed to snow at both stations. Weak low-level cold advection was indicated at BGM just prior to the change from rain to snow on the 25th, while weak low-level warm advection was indicated at ELM.