| Created with the Web Accessibility Wizard |
Time Height Charts – omega and temperature
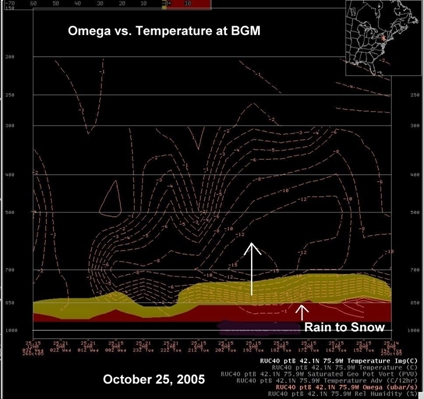
October 25th
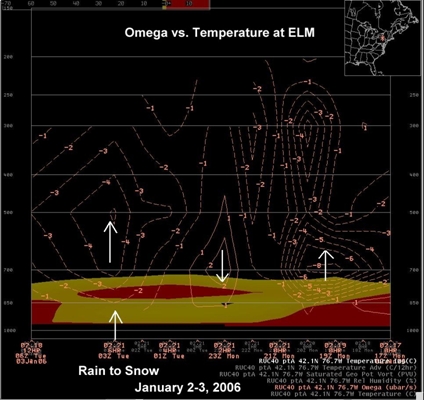
January 2nd
Slide Links:
Speaker Notes:
These charts compare the patterns of model forecast vertical motion at BGM on the 25th to the patterns of model forecast vertical motion at ELM on the 2-3rd. On the 25th, the RUC forecast strong mid-level upward vertical motion during and after the change-over, however little if any vertical motion is indicated at low-levels. On the 25th, the RUC forecast some subsidence just prior to the forecast development of a weak warm wedge late in the afternoon on the 2nd between 800 and 900 mb. Little vertical motion is forecast at low-levels during the time when rain changed to snow.