500 mb Analyses at 0000 and 1200 UTC, 3 June
Notes:
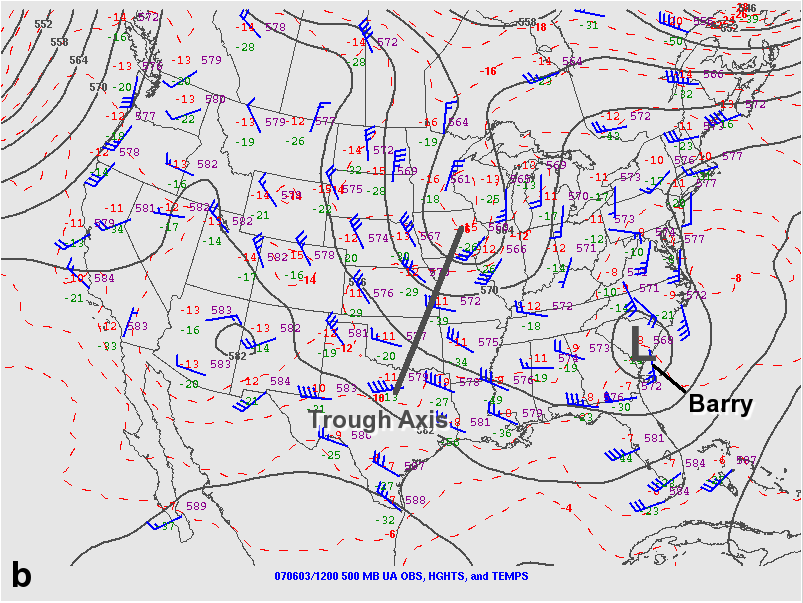
500 mb upper-air analyses from 0000 UTC, 3 June (a) and 1200 UTC, 3 June (b). Primary mid-level trough axes are shown with thick black lines, while the positions of Tropical Depression Barry are outlined with black stars. These upper-air runs were closest to the time of convective development over the Ohio Valley and Northeastern U.S. on these days.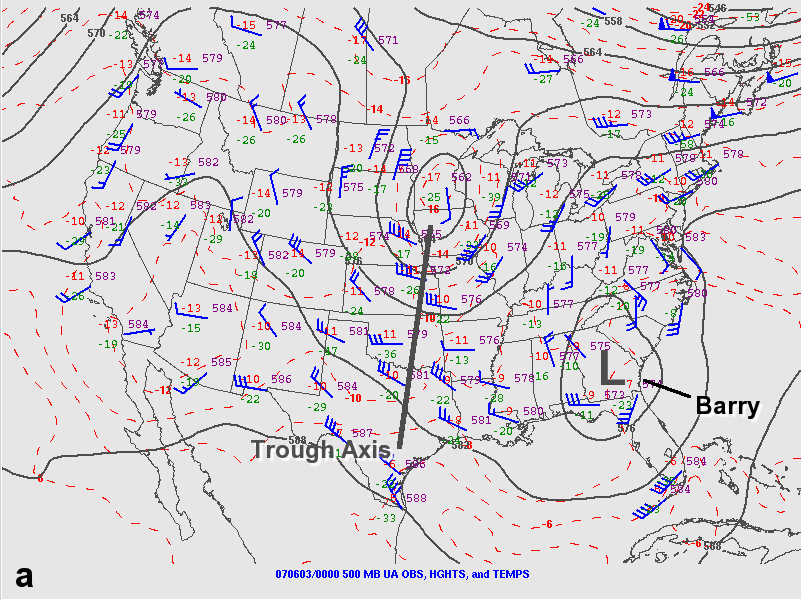
Slide 23
|
|
|||
| National Weather Service Binghamton Weather Forecast Office 32 Dawes Drive Johnson City, NY 13790 (607) 729-1597 Page last modified: June 26, 2007. |
|||